Record a browser clickpath
Your web application provides certain key functionality to your customers that is critical to the success of your business. Monitoring your application via browser clickpaths ensures that this functionality is available to your customers 24/7.
With our easy-to-use DESK Synthetic Recorder (a Google Chrome browser extension), you can gain visibility into the availability and performance of your application's most important functionality involving all the elements of your IT infrastructure with just a few clicks.
Use the DESK Synthetic Recorder to record the exact sequences of interaction that you want your simulated user visits to follow when browser monitors are replayed. You can record button clicks, page scrolls, and even user input. The recorder captures each event and converts it into a script that is played back each time you run the clickpath.
Install the DESK Synthetic Recorder extension
You need to install DESK Synthetic Recorder to begin. After installation, the recorder is automatically updated whenever new features become available.
- Select Synthetic from the navigation menu.
- Click Create a synthetic monitor > Create a browser monitor.
- First-time users are asked to install the Chrome extension. Click Install DESK recorder at the bottom of the page.
- On the extension page, click Add to Chrome > Add Extension.
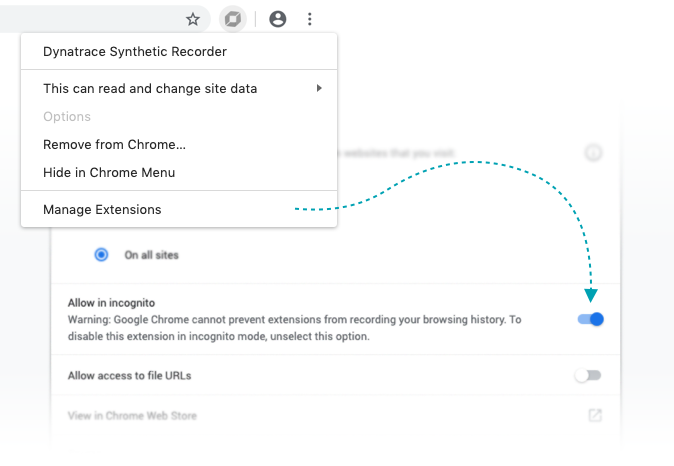
Enable the "Allow in incognito" permission
After the installation of the DESK Synthetic Recorder extension make sure to enable the Allow in incognito permission. This is necessary to have a clean browser state for recording as well as local playback via the Chrome incognito mode.
- Navigate to the extension settings by right-clicking the DESK icon in the Chrome menu bar and choose Manage extensions.
- In the extension settings, enable the Allow in incognito option.
Record a browser clickpath
-
Select Synthetic from the navigation menu.
-
Click the Create a synthetic monitor button.
-
Click Create a browser monitor.
-
Enter a valid URL and check the default Name for your clickpath on the Configure a browser monitor page.
-
Continue to configure the monitor—device profile, frequency, monitoring locations, and other options such as cookies and automated login. Click Record clickpath or Manually create clickpath when done.
-
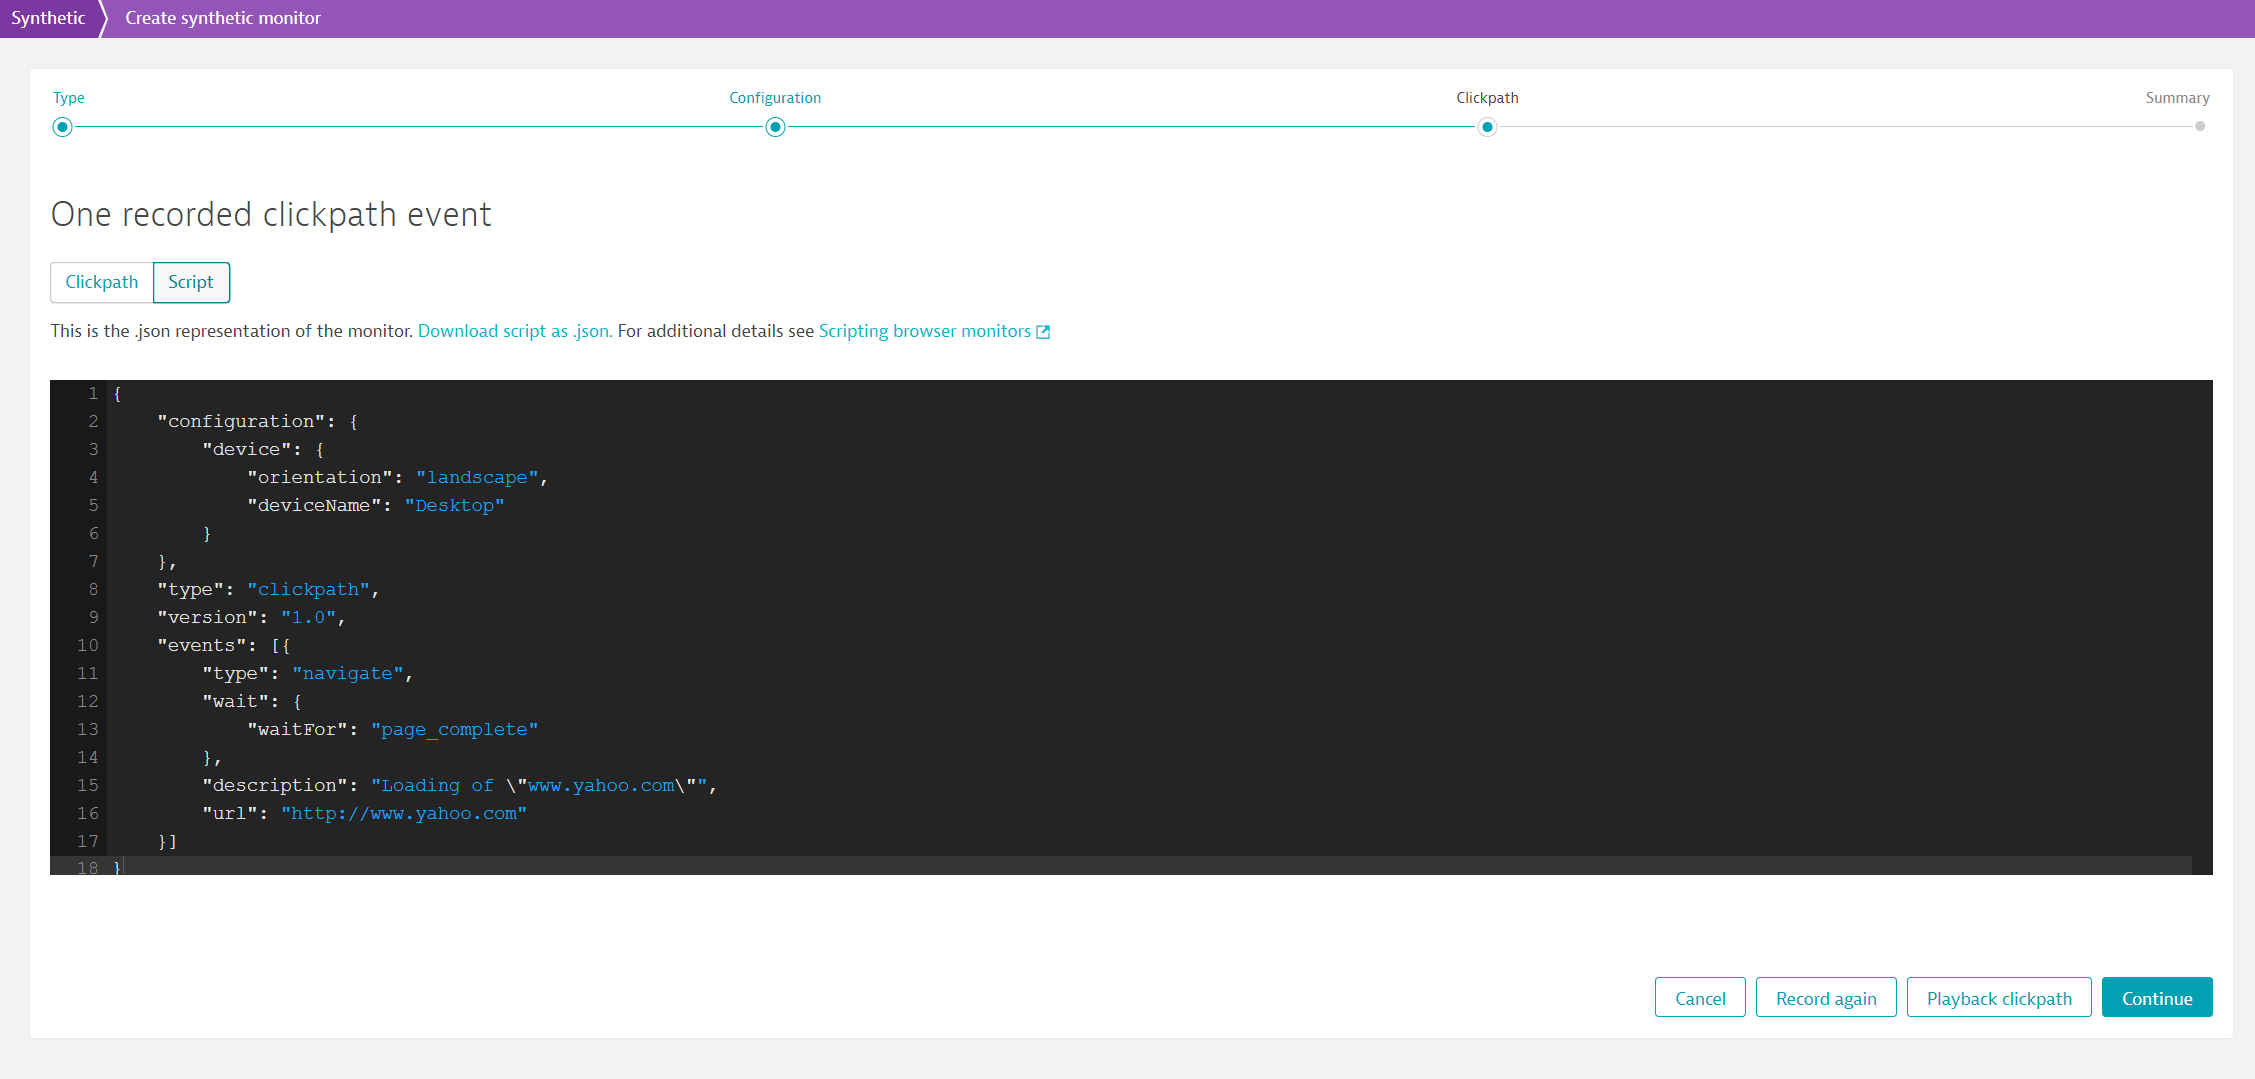
For manual clickpath creation, you can edit in visual (Clickpath) or Script mode. When done adding events to your script, click Continue. You can also Play back clickpath or Record again.
-
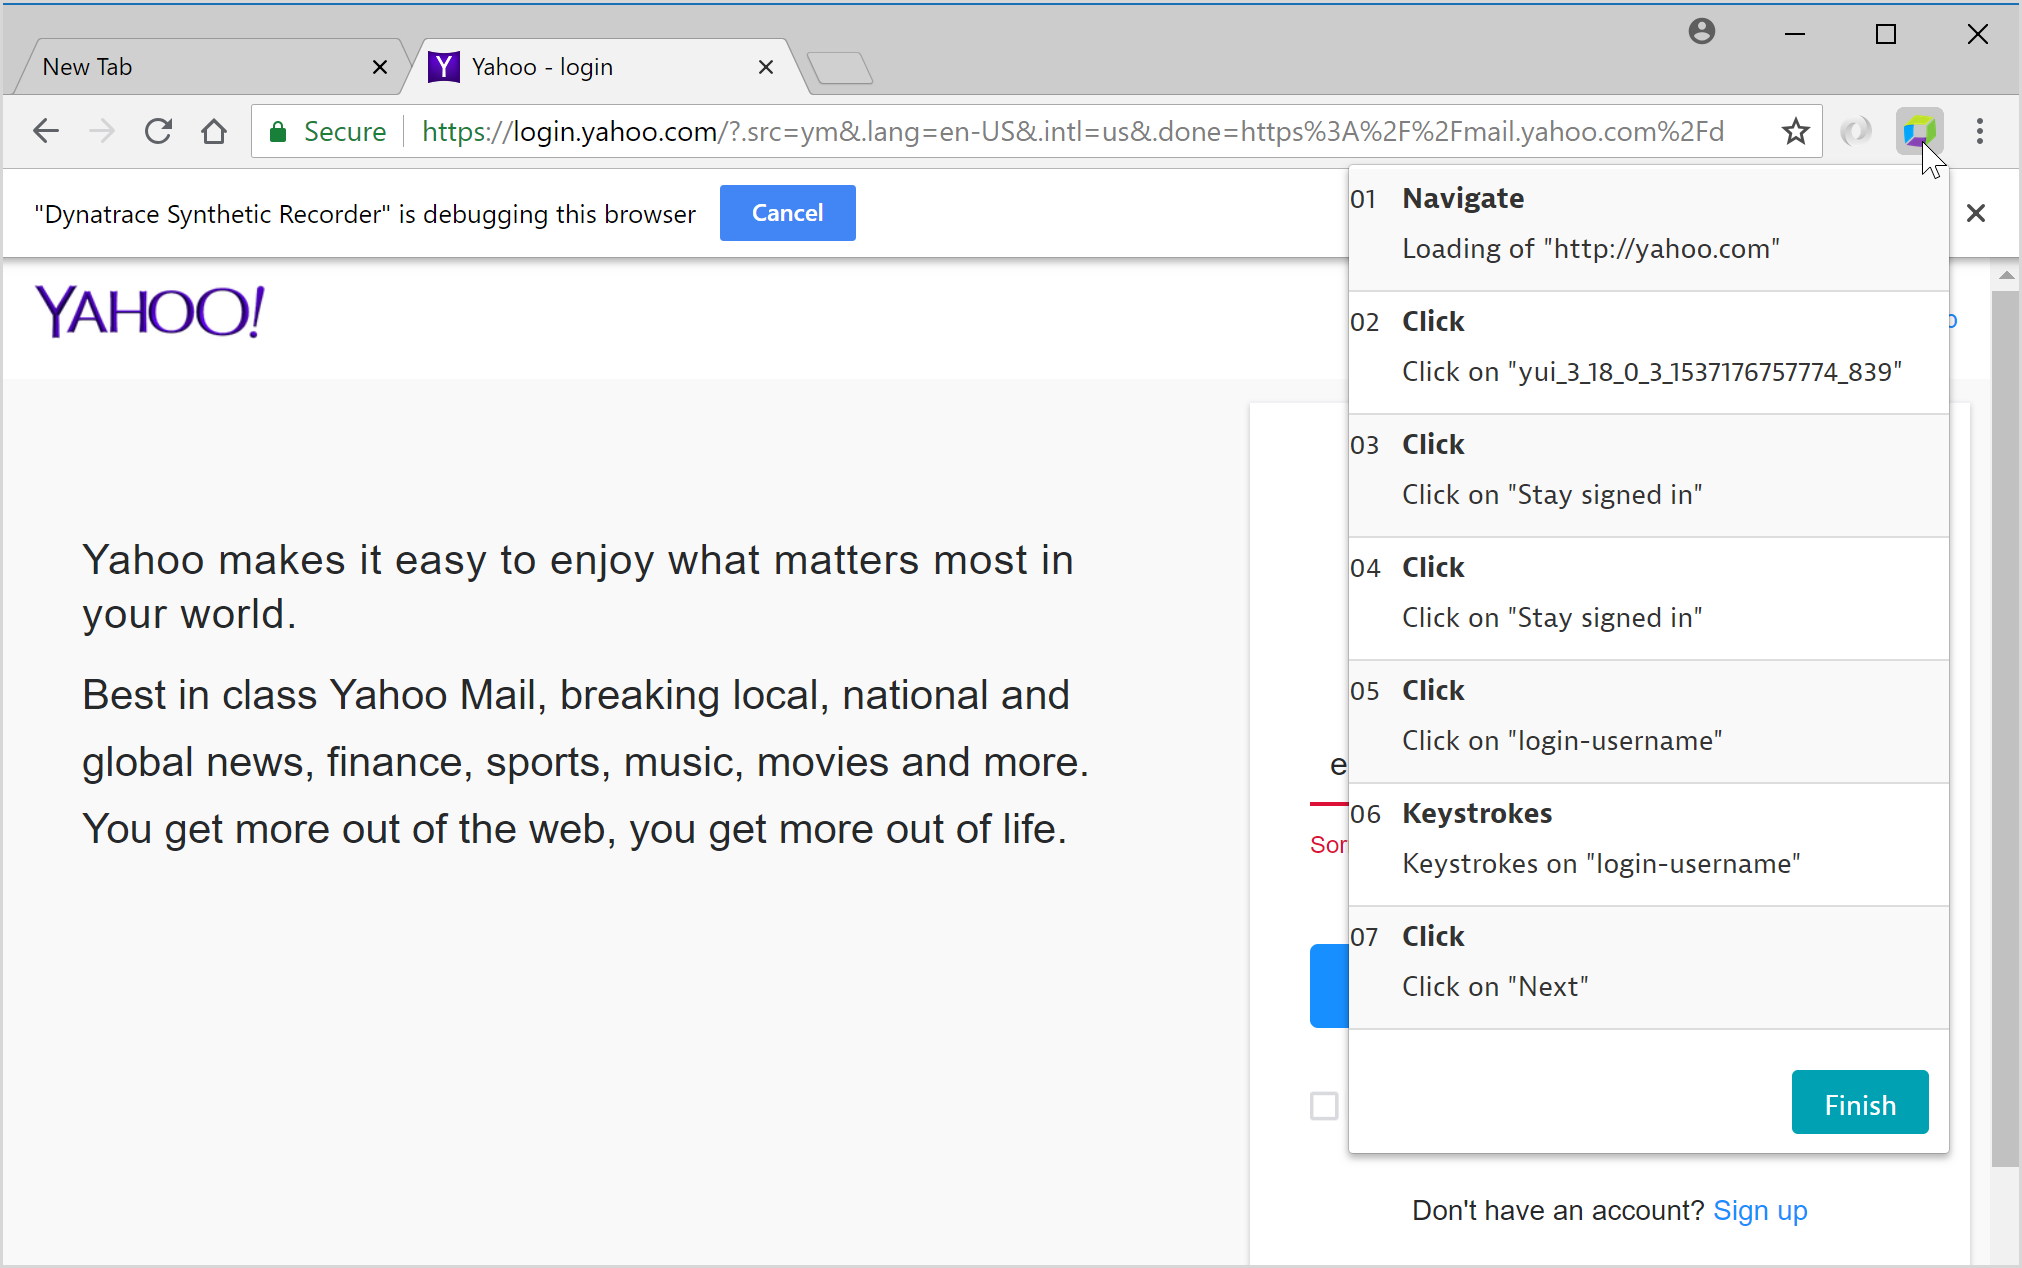
If recording, in the recorder browser instance that pops up, click through your application to simulate a key use case (for example, logging in, searching for a product, or placing an order). As you interact with your application, each event is recorded for future playback.
Note
Browser clickpaths are hard-coded to time out after 5 minutes. When recording a clickpath, ensure that the clickpath doesn't exceed this time limit.- When done, click the DESK extension icon on your browser's menu bar to see a list of recorded events and Finish recording.
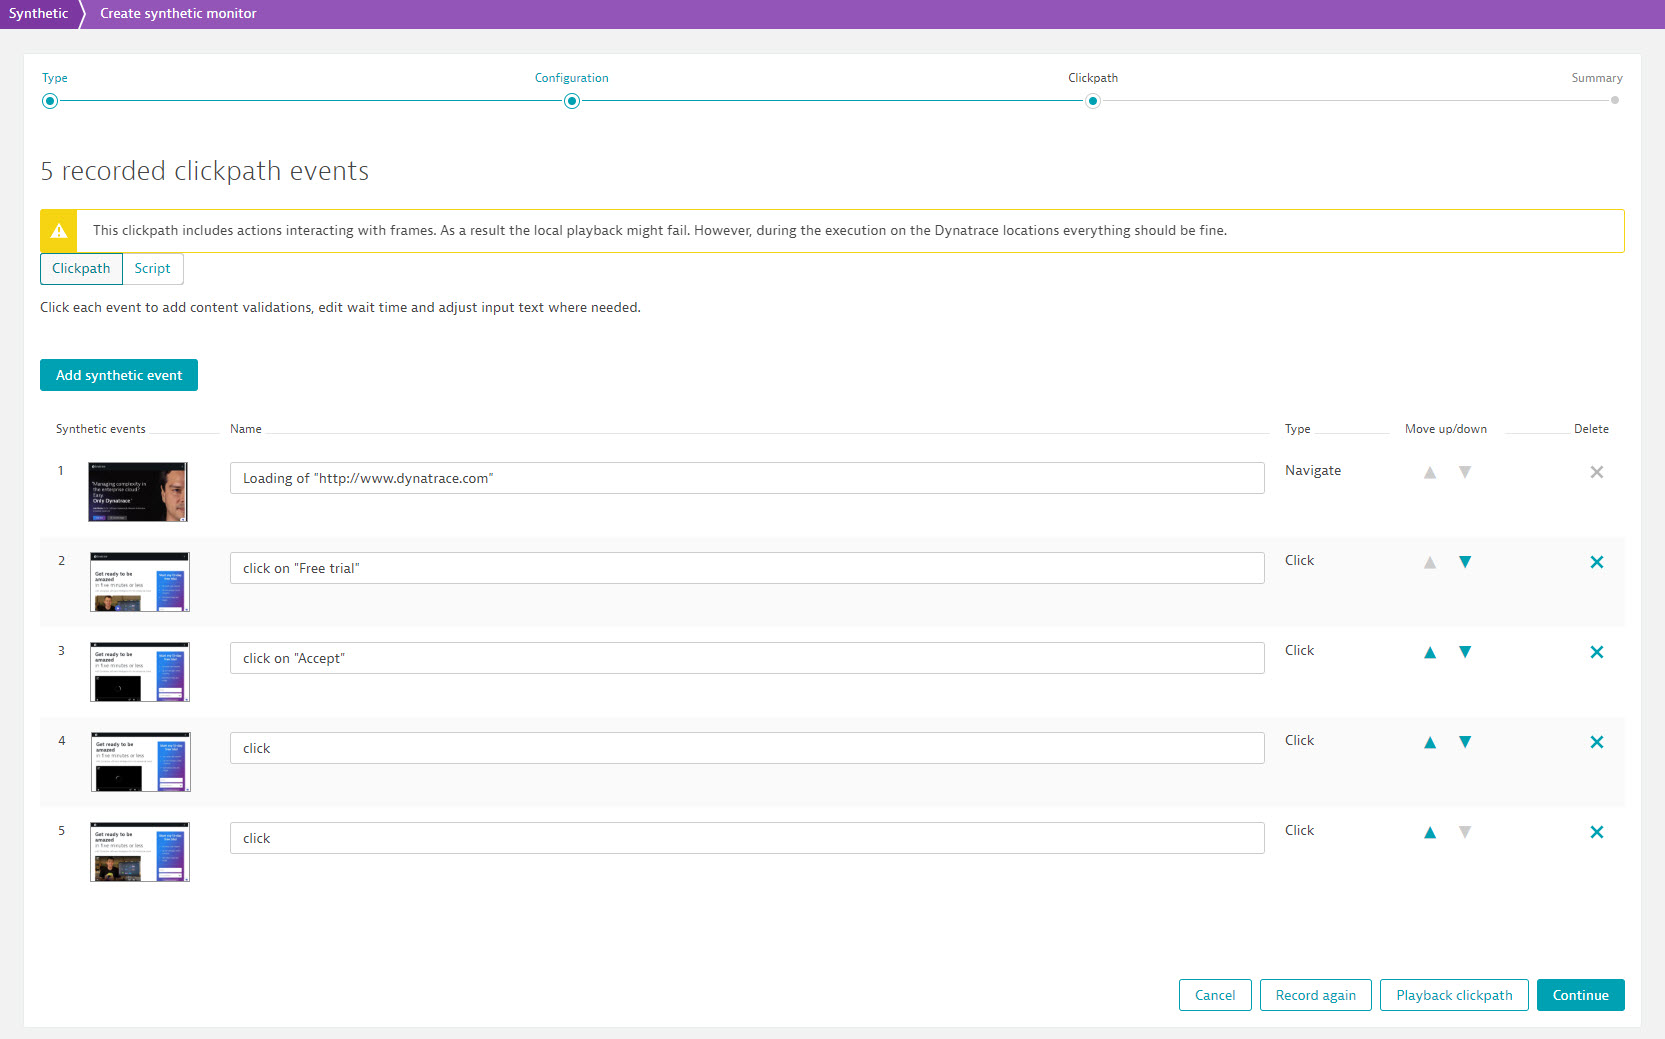
- Events in your recorded clickpath are displayed. You can edit each event, for example, to add content validation or adjust wait time where needed.
- Click Continue. (You can also Cancel, Playback, or Record your clickpath again.)
- When done, click the DESK extension icon on your browser's menu bar to see a list of recorded events and Finish recording.
Local playback in DESK is in emulation mode, based on the device profile and user agent you select during monitor configuration. That is, playback emulates your chosen device. If you navigate to the same URL or perform the same transaction outside DESK, your experience might vary.
-
-
On the Summary screen, you can review and change your configuration (Change URL or name; Change configuration).
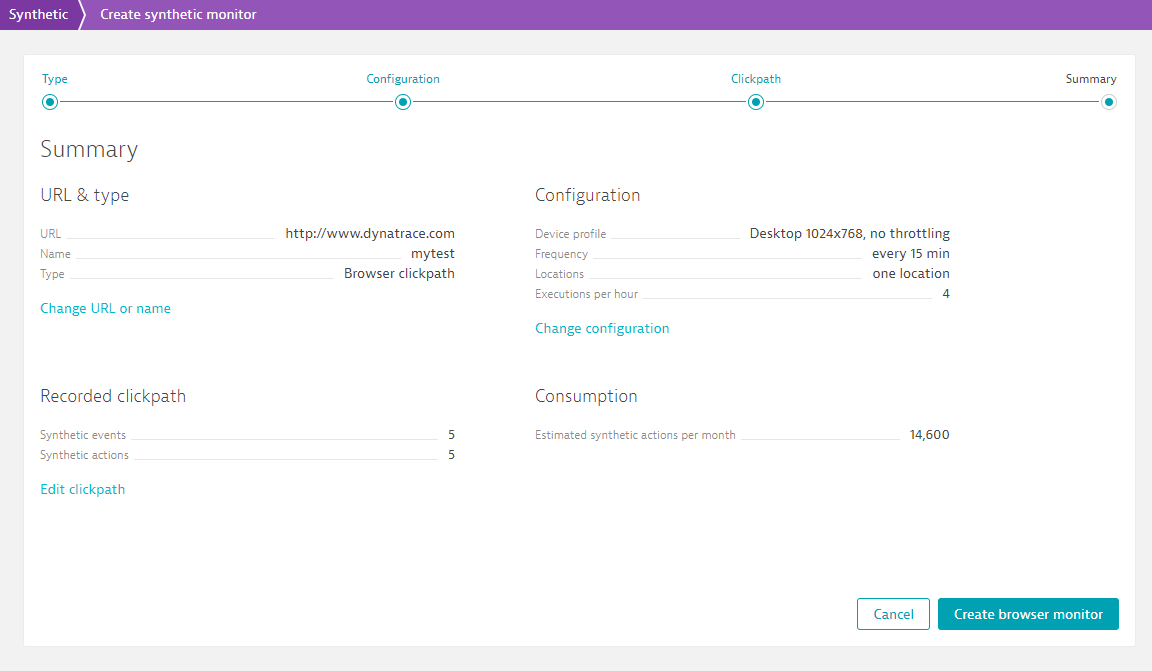
See Number of actions consumed by browser clickpaths for an explanation of the difference between actions and events.
-
Click Create browser monitor. Within a few minutes, you'll receive monitoring data for your new browser clickpath.
View the analytics of a browser clickpath
- Select Synthetic from the navigation menu.
- Optionally, click Browser clickpath to filter for browser clickpaths.
- From the list of monitors, click the browser clickpath you want to examine. You'll then be directed to the Synthetic details page of the clickpath.
The details page of each monitor provides detailed results, for example, availability metrics and problems detected.
Click the Browse (...) button and select View report. Select the month and week for your report time frame.
While viewing the Availability report, you can choose to receive a weekly or a monthly availability report and even share the report by clicking the Browse (...) button and selecting the respective option.
When you first set up your monitor, reports are available after the first weekly run (made at midnight on Sundays).
Disable or delete a browser clickpath
- Navigate to the Synthetic dashboard.
- Opt to view the dashboard in list format.
- Check the box next to the monitor you want to delete or disable.
- Click Delete or Disable at bottom right.

You can also delete a monitor from the details page:
- Select Synthetic from the navigation menu.
- Click the monitor you're interested in.
- Click the Browse (...) button and select either Disable or Delete.