Application anomaly detection API - GET configuration
Gets the configuration of anomaly detection for applications.
The request produces an application/json payload.
| GET |
|
Parameters
The request doesn't provide any configurable parameters.
Response format
The ApplicationAnomalyDetectionConfig object
The configuration of anomaly detection for applications.
| Element | Type | Description |
|---|---|---|
| metadata | ConfigurationMetadata | Metadata useful for debugging. |
| responseTimeDegradation | ResponseTimeDegradationDetectionConfig | How to detect response time degradation. |
| trafficDrop | TrafficDropDetectionConfig | How to detect traffic drops. |
| trafficSpike | TrafficSpikeDetectionConfig | How to detect traffic spikes. |
| failureRateIncrease | FailureRateIncreaseDetectionConfig | How to detect failure rate increase. |
The FailureRateIncreaseDetectionConfig object
Configuration of failure rate increase detection.
| Element | Type | Description |
|---|---|---|
| detectionMode | string | How to detect failure rate increase: automatically, or based on fixed thresholds, or do not detect. |
| automaticDetection | FailureRateIncreaseAutodetectionConfig | Parameters of automatic failure rate increase detection. Required if detectionMode is The absolute and relative thresholds both must be exceeded to trigger an alert. Example: If the expected error rate is 1.5%, and you set an absolute increase of 1%, and you set a relative increase of 50%, the thresholds will be: Absolute: 1.5% + 1% = 2.5% Relative: 1.5% + 1.5% * 50% = 2.25% |
| thresholds | FailureRateIncreaseThresholdConfig | Fixed thresholds for failure rate increase detection. Required if the detectionMode is |
The FailureRateIncreaseThresholdConfig object
Fixed thresholds for failure rate increase detection.
Required if detectionMode is DETECT_USING_FIXED_THRESHOLDS. Not applicable otherwise.
| Element | Type | Description |
|---|---|---|
| threshold | integer | Failure rate during any 5-minute period to trigger an alert, %. |
| sensitivity | string | Sensitivity of the threshold. With With |
The FailureRateIncreaseAutodetectionConfig object
Parameters of failure rate increase auto-detection. Required if detectionMode is DETECT_AUTOMATICALLY. Not applicable otherwise.
The absolute and relative thresholds both must exceed to trigger an alert.
Example: If the expected error rate is 1.5%, and you set an absolute increase of 1%, and a relative increase of 50%, the thresholds will be: Absolute: 1.5% + 1% = 2.5% Relative: 1.5% + 1.5% * 50% = 2.25%
| Element | Type | Description |
|---|---|---|
| failingServiceCallPercentageIncreaseAbsolute | integer | Absolute increase of failing service calls to trigger an alert, %. |
| failingServiceCallPercentageIncreaseRelative | integer | Relative increase of failing service calls to trigger an alert, %. |
The TrafficSpikeDetectionConfig object
The cofiguration of traffic spikes detection.
| Element | Type | Description |
|---|---|---|
| enabled | boolean | The detection is enabled ( |
| trafficSpikePercent | integer | Alert if the observed traffic is more than X % of the expected value. |
The TrafficDropDetectionConfig object
The configuration of traffic drops detection.
| Element | Type | Description |
|---|---|---|
| enabled | boolean | The detection is enabled ( |
| trafficDropPercent | integer | Alert if the observed traffic is less than X % of the expected value. |
The ResponseTimeDegradationDetectionConfig object
Configuration of response time degradation detection.
| Element | Type | Description |
|---|---|---|
| detectionMode | string | How to detect response time degradation: automatically, or based on fixed thresholds, or do not detect. |
| automaticDetection | ResponseTimeDegradationAutodetectionConfig | Parameters of automatic response time degradation detection. Required if detectionMode is Violation of any criterion triggers an alert. |
| thresholds | ResponseTimeDegradationThresholdConfig | Fixed thresholds for response time degradation detection. Required if detectionMode is |
The ResponseTimeDegradationThresholdConfig object
Fixed thresholds for response time degradation detection.
Required if detectionMode is DETECT_USING_FIXED_THRESHOLDS. Not applicable otherwise.
| Element | Type | Description |
|---|---|---|
| responseTimeThresholdMilliseconds | integer | Response time during any 5-minute period to trigger an alert, in milliseconds. |
| slowestResponseTimeThresholdMilliseconds | integer | Response time of the 10% slowest during any 5-minute period to trigger an alert, in milliseconds. |
| loadThreshold | string | Minimal service load to detect response time degradation. Response time degradation of services with smaller load won't trigger alerts. |
| sensitivity | string | Sensitivity of the threshold. With With |
The ResponseTimeDegradationAutodetectionConfig object
Parameters of the response time degradation auto-detection. Required if the detectionMode is DETECT_AUTOMATICALLY. Not applicable otherwise.
Violation of any criterion triggers an alert.
| Element | Type | Description |
|---|---|---|
| responseTimeDegradationMilliseconds | integer | Alert if the response time degrades by more than X milliseconds. |
| responseTimeDegradationPercent | integer | Alert if the response time degrades by more than X %. |
| slowestResponseTimeDegradationMilliseconds | integer | Alert if the response time of the slowest 10% degrades by more than X milliseconds. |
| slowestResponseTimeDegradationPercent | integer | Alert if the response time of the slowest 10% degrades by more than X %. |
| loadThreshold | string | Minimal service load to detect response time degradation. Response time degradation of services with smaller load won't trigger alerts. |
The ConfigurationMetadata object
Metadata useful for debugging
| Element | Type | Description |
|---|---|---|
| configurationVersions | integer[] | A Sorted list of the version numbers of the configuration. |
| clusterVersion | string | DESK server version. |
{
  "responseTimeDegradation": {
    "detectionMode": "DETECT_AUTOMATICALLY",
    "automaticDetection": {
      "responseTimeDegradationMilliseconds": 250,
      "responseTimeDegradationPercent": 90,
      "slowestResponseTimeDegradationMilliseconds": 500,
      "slowestResponseTimeDegradationPercent": 200,
      "loadThreshold": "ONE_REQUEST_PER_MINUTE"
    }
  },
  "trafficDrop": {
    "enabled": true,
    "trafficDropPercent": 95
  },
  "trafficSpike": {
    "enabled": false
  },
  "failureRateIncrease": {
    "detectionMode": "DETECT_USING_FIXED_THRESHOLDS",
    "thresholds": {
      "threshold": 10,
      "sensitivity": "LOW"
    }
  }
}
Example
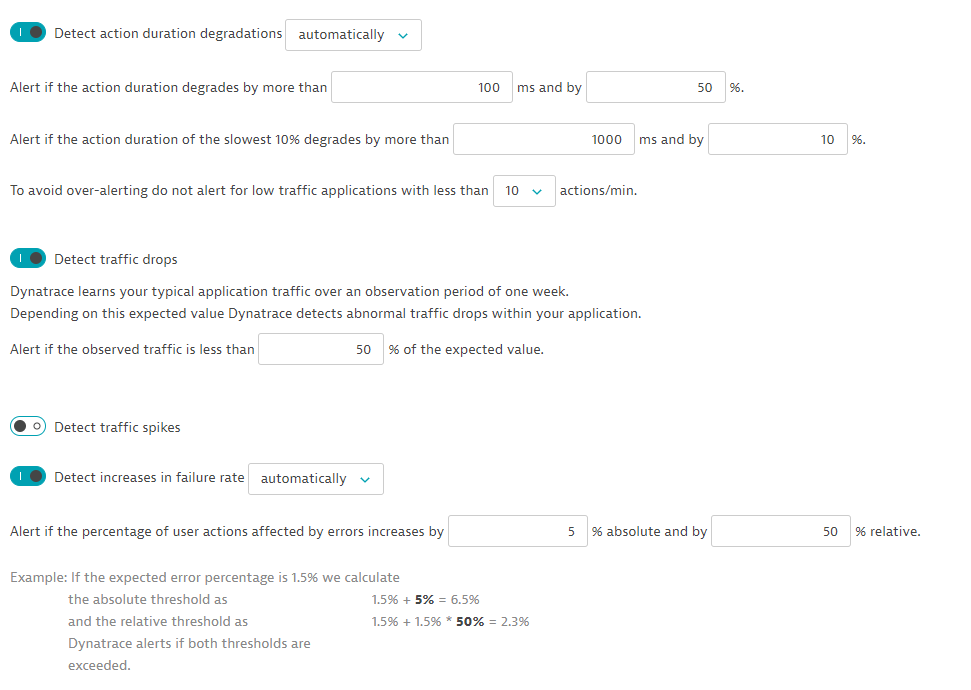
In this example, the request lists the current configuration of anomaly detection for applications.
The API token is passed in the Authorization header.
The configuration has the following settings:
Curl
curl -X GET \
  https://mySampleEnv.live.dexp.ae/api/config/v1/anomalyDetection/applications \
  -H 'Authorization: Api-token abcdefjhij1234567890'
Request URL
https://mySampleEnv.live.dexp.ae/api/config/v1/anomalyDetection/applications
Response body
{
  "metadata": {
    "clusterVersion": "1.163.0.20190130-210004",
    "configurationVersions": [
      2
    ]
  },
  "responseTimeDegradation": {
    "detectionMode": "DETECT_AUTOMATICALLY",
    "automaticDetection": {
      "responseTimeDegradationMilliseconds": 100,
      "responseTimeDegradationPercent": 50,
      "slowestResponseTimeDegradationMilliseconds": 1000,
      "slowestResponseTimeDegradationPercent": 10,
      "loadThreshold": "TEN_REQUESTS_PER_MINUTE"
    }
  },
  "trafficDrop": {
    "enabled": true,
    "trafficDropPercent": 50
  },
  "trafficSpike": {
    "enabled": false
  },
  "failureRateIncrease": {
    "detectionMode": "DETECT_AUTOMATICALLY",
    "automaticDetection": {
      "failingServiceCallPercentageIncreaseAbsolute": 5,
      "failingServiceCallPercentageIncreaseRelative": 50
    }
  }
}
Response code
200