JMX plugins
JMX technology (Java Management Extensions) is ideal for monitoring applications built using Java technology. With DESK, you can monitor any metric in your JVM that is exposed via an MBean.
Create a JMX plugin
- Sign in to DESK and go to Settings > Monitoring > Monitored technologies and click Add new technology monitoring. Of the four available options, one is Monitor Java or WebSphere based technologies. Click Add JMX/PMI plugin.
- Click Use JMX/PMI plugins editor.
- Type the plugin name. You can only use letters
A-Z, a-z, numbers0-9, or-/_. - Add the metrics source.
- Select one of the available technologies.
- Based on your selection, the editor will suggest the Java process as a source for your metrics. This narrows the list of available MBeans or PMI modules you will use in the next step. The technology behind the process determines whether you'll browse JMX MBeans or PMI modules. Click Add metrics source to use a suggested source. Click
 to select a different process. When selecting it, you can narrow the list of available processes by choosing a particular host or Management Zone.
Note
Selecting the process, host, or Management Zone doesn't limit the plugin monitoring scope. JMX/PMI plugins monitor all Java processes accessible to OneAgent. The metric defined for the same MBean and attribute will be also available in other Java processes across your application, which can quickly exhaust your custom metric limit.
You can also select individual hosts on which to run your new JMX plugin, instead of running it globally across your whole environment.
- Immediately after you add your JMX plugin, go to Settings> Monitored technologies > Custom plugins tab and disable it globally.
- Navigate to individual host pages, open the host settings, find your JMX plugin and enable it.
-
When the metrics list is downloaded, click the Add metric button to start creating your plugin.
Domain
Select the domain.
Select key properties
Key properties filter the list of available MBeans. Note that property values can contain wildcards. Select Exact match to filter MBeans list only to the entries matching the exact key property values.
Select MBean
Select one MBean from the list or leave All matching MBeans option. If more than one MBean is matched, this will cause the aggregation of attributes from all matching MBeans into one metric. You will define the aggregation type below.
Select attribute
The attributes available in the list are only the numeric ones. To see other attributes, for example attributes of the
Stringtype, select Include non-numeric attributes. Note that selected attributes must be parsable to double, or boolean type. Otherwise, DESK OneAgent will not collect any data from such a metric.Display name
You can define a custom display name for the metric.
Unit
Select the metric unit.
Aggregation
Select the aggregation method if you're pulling an attribute from a number of matching Mbeans.
Calculation
Delta calculates the change in values of the given attribute. Rate calculates the rate of changes per seconds. When you select both, you can convert an absolute attribute (eg. Request Count) to a rate (eg. Requests per Second). Value = attribute / query interval.
Dimension
You can segment the metric using any MBean's key property as a dimension. Select Metric dimension and choose one of the available key properties as a dimension.
Creating the PMI plugin
Creating the PMI plugin is very similar to the JMX plugin. PMI Module translates to JMX Mbean and statistics to attributes. All other settings behave accordingly.
Saving the plugin
After you add the metric, you can still edit or delete its definition. You must click the Save button to register the plugin and start collecting data from all Java processes that contain defined MBeans. After you save the plugin, you cannot edit or delete the metrics, as this way we're able to maintain the continuity of your data. You can still add the new metrics. This time however, you won't be able to select the base Java process, because you will use a process where the plugin is already deployed.
Customizing your plugin
The DESK JMX plugins are highly customizable beyond the capabilities of the editor. You can download your plugin and edit its JSON file that describes your JMX metrics and how you want to display them. For complete instructions and examples, see the DESK JMX Extensions on GitHub.
You need to create a JSON file that describes your JMX metrics and how you want to display them. For complete instructions and examples, visit the DESK JMX Extensions on GitHub.
Upload a JMX plugin
- To add a JMX plugin to DESK, go to Settings > Monitored technologies > Custom plugins and click Upload plugin.
- Select the
plugin.jsonfile of your JMX plugin.
Once successfully uploaded, your plugin is listed on the Custom plugins page. You don't need to restart your JVM to enable JMX plugins or make changes effective.
Note: If in the future you make changes to your plugin, remember to upload the updatedplugin.jsonfile to DESK.
Viewing JMX metrics in DESK
Note:
JMX metrics are available for all Java-based processes monitored by OneAgent.
Once your plugin is uploaded, DESK automatically begins querying the defined metrics for all Java processes. To find the metrics, go to a relevant process page and click Further details.
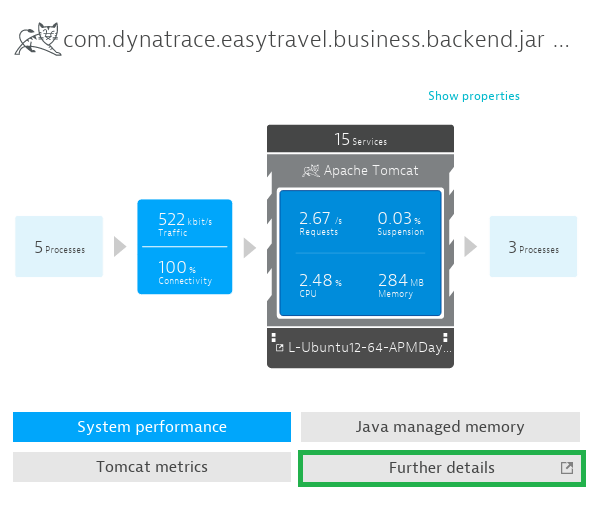
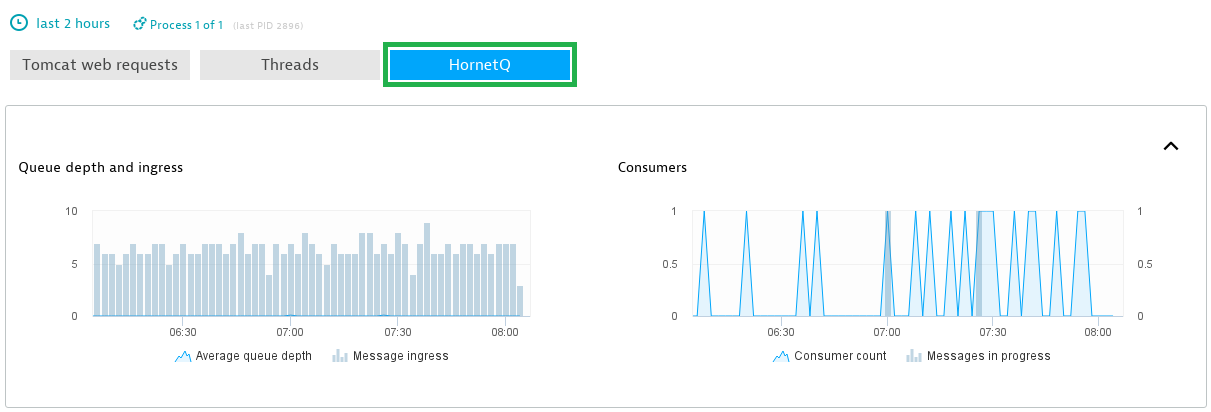
For example, for a plugin named HornetQ, go to the process you selected when creating the plugin, click Further details and then select the HornetQ tab named automatically after the plugin name. You'll find all the defined metrics there.