ActiveGate plugins JSON explained
The plugin.json is your plugin definition. Starting with the metrics used by the plugin to the favicon and plugin configuration fields.
Logicaly it can be divided into 4 parts: metadata, UI, Metrics and Configuration.
Example:
Demo JSON
{
  "name": "custom.remote.python.example",
  "version": "1.17",
  "productiveMinVersion": "1.000",
  "requiredAgentVersion": "1.000",
  "type": "python",
  "entity": "CUSTOM_DEVICE",
  "metricGroup": "tech.Example_Service",
  "technologies": ["EXAMPLE_SERVICE"],
  "source": {
    "package": "demo_activegate_plugin_multi",
    "className": "RemoteExamplePlugin",
    "install_requires": [
      "requests>=2.6.0"
    ],
    "activation": "Remote"
  },
  "ui" : {
    "keymetrics" : [
      {
        "key": "databases.table_size",
        "aggregation": "max",
        "mergeaggregation": "sum",
        "displayname": "Total table size"
      }
    ],
    "keycharts" : [
        {
            "group": "Service state",
            "title": "State",
            "series": [
            {
                "key": "service.state_5",
                "displayname": "Status",
                "seriestype": "bar",
                "statecolors": ["#ff3333", "#ffd633", "#00b33c"],
                "statechart": true
            }]
        },
        {
            "group": "Disk usage",
            "title": "Total disk usage",
            "series": [
            {
                "key": "databases.table_size",
                "displayname": "Sum of databases size",
                "seriestype": "area",
                "color": "#74cff7"
            }]
        }
        ],
    "charts" : [
      {
        "group": "Memory",
        "title": "Per table usage",
        "series": [
            {
                "key": "databases.table_size",
                "displayname": "Per table size",
                "seriestype": "area",
                "color": "#74cff7",
                "metricexplanation": "How big is each table"
            }
        ]
      },
       {
        "group": "Entries",
        "title": "Total num entries",
        "series": [
            {
                "key": "databases.total_num_entities",
                "displayname": "Total number of entries",
                "seriestype": "line",
                "color": "#74cff7",
                "metricexplanation": "How big is each table"
            }
        ]
      },
      {
        "group": "Entries",
        "title": "Archives",
        "series": [
            {
                "key": "databases.replicated_entries",
                "displayname": "Number of entries archived",
                "seriestype": "bar",
                "color": "#74cff7",
                "metricexplanation": "Number of metrics moved to archive"
            }
        ]
      },
      {
        "group": "Connections",
        "title": "Archives",
        "series": [
            {
                "key": "service.querries_per_second",
                "displayname": "Connections per second",
                "seriestype": "bar",
                "color": "#74cff7",
                "metricexplanation": "Connections per second"
            }
        ]
      }
    ]
  },
  "metrics": [
    { "statetimeseries": {"key": "service.state_5", "states": ["DOWNTIME", "MAINTENANCE", "WORKING"], "displayname": "Service State", "source": {"state_entrypoint": "/api/state" }}, "entity": "CUSTOM_DEVICE"},
    {
      "timeseries": { "key": "service.querries_per_second", "unit":"PerSecond", "displayname": "Querries per second", "aggregation": "AVG"},
      "entity": "CUSTOM_DEVICE_GROUP",
      "alert_settings": [{
        "alert_id": "custom_connections_alert",
        "event_type": "AVAILABILITY_EVENT",
        "event_name": "No connections!",
        "description": "The {metricname} of {severity} is {alert_condition} the threshold of {threshold}",
        "threshold": 0.01,
        "alert_condition": "ABOVE",
        "samples":5,
        "violating_samples":1,
        "dealerting_samples":5
      }]
    },
    { "timeseries": { "key": "databases.table_size", "unit":"MegaByte", "displayname": "Table size", "aggregation": "MAX", "dimensions": ["table_name"]}, "entity": "CUSTOM_DEVICE"},
    { "timeseries": { "key": "databases.total_num_entities", "unit": "Count", "displayname": "Total num ", "aggregation": "MAX" }, "entity": "CUSTOM_DEVICE"},
    { "timeseries": { "key": "databases.replicated_entries", "unit": "Count", "displayname": "Archived Entries", "aggregation": "SUM" }, "entity": "CUSTOM_DEVICE"}

  ],
  "properties": [
    {
      "key": "url",
      "type": "String"
    },
    {
      "key": "auth_user",
      "type": "String"
    },
    {
      "key": "auth_password",
      "type": "Password"
    },
    {
      "key": "state_interval",
      "type": "Integer",
      "defaultValue": 60
    },
    {
      "key": "alert_interval",
      "type": "Integer",
      "defaultValue": 360
    },
    {
      "key": "event_interval",
      "type": "Integer",
      "defaultValue": 240
    },
    {
      "key": "relative_interval",
      "type": "Integer",
      "defaultValue": 60
    }
  ],
"configUI" :{
    "displayName": "CustomCloudTechnology",
        "properties" : [
          { "key" : "url", "displayName": "URL", "displayOrder": 3, "displayHint": "http://localhost:9200/" },
          { "key" : "auth_user", "displayName": "User", "displayOrder": 1, "displayHint": "Leave empty if no authentication is set up" },
          { "key" : "auth_password", "displayName": "Password", "displayOrder": 2, "displayHint": "Leave empty if no authentication is set up", "defaultValue": "somepassword"},
          { "key" : "state_interval", "displayName": "State change interval", "displayOrder": 3, "displayHint": "How often state metrics changes", "defaultValue": 60},
          { "key" : "alert_interval", "displayName": "Alert interval", "displayOrder": 4, "displayHint": "How often an alert is raised", "defaultValue": 360},
          { "key" : "event_interval", "displayName": "Event interval", "displayOrder": 5, "displayHint": "How often an event is raised", "defaultValue": 240},
          { "key" : "relative_interval", "displayName": "Relative interval", "displayOrder": 6, "displayHint": "How often relative metric is submitted", "defaultValue": 60}
        ]
  }
}
Metadata
The top-level metadata section contains a list of properties used to identify your plugin.
plugin.json top level
| Field | Type | Required | Description | Validation |
|---|---|---|---|---|
| name | string | True | A unique plugin name in Java package format. | minLength: 1, pattern: ^custom.remote.python.([a-zA-Z][a-zA-Z0-9_-]*)+$ |
| version | string | True | The plugin version, must be updated whenever the plugin definition is updated. | pattern: ^\d+.\d+(.\d+)?$ |
| technologies | array of strings | True | Type of technology that plugin monitors, as can be viewed on Technologies overview page. | |
| favicon | string | False | link to favicon that should be used on technology tile | |
| entity | string | True | Entity type upon which the plugin is activated | enum: ['CUSTOM_DEVICE', 'CUSTOM_DEVICE_GROUP'] |
| metricGroup | string | True | Metric group is used for grouping custom metrics into a hierarchical namespace where different sources, for example multiple plugins can contribute. Moreover, metric group becomes primary part of metric key. Hence once defined it could not be changed. | minLength: 1, pattern: ^(/?[-a-zA-Z0-9_.]+)+$ |
| source | object | False | Python metadata used by ActiveGate PluginModule python engine | |
| metrics | array | True | The section defining metrics; see Metrics section for reference | uniqueItems: True |
| properties | array of objects | False | Configuration properties the plugin can accept. | |
| ui | object | False | This part of the JSON defines how metrics are charted on each Process page. | |
| configUI | object | False | The configUI section defines the configuration fields that are displayed in the UI. |
Source
The source section lists the package name and class that is to be imported and executed by ActiveGate. This corresponds to the name of the Python file that contains the code and the name of the class that’s defined in it. This information is required by the ActiveGate Plugin Module Python engine.
Example source section
{
    "package": "remote_example",
    "className": "RemoteExamplePlugin",
    "install_requires": [
      "requests>=2.6.0"
    ]
  }
Source metadata section
| Field | Type | Required | Description | Validation |
|---|---|---|---|---|
| package | string | True | Python package that has plugin class | |
| className | string | True | Name of plugins main python class. Must inherit from BasePlugin. | |
| install_requires | array of strings | False | Relates to Python packaging, see: https://setuptools.readthedocs.io/en/latest/setuptools.html#declaring-dependencies | |
| packages | array of strings | False | Relates to Python packaging, see: https://docs.python.org/3.6/distutils/setupscript.html | |
| package_data | array of strings | False | Relates to Python packaging, see: https://docs.python.org/3.6/distutils/setupscript.html | |
| modules | array of strings | False | Relates to Python packaging, see: https://docs.python.org/3.6/distutils/setupscript.html |
Technologies and favicon
The technologies and favicon properties determine how your technology is presented on the Technology overview page.
To have the data from your plugin displayed on an existing technology tile, set a corresponding technology name. You can look up the configured technology names in the ActiveGate plugins JSON reference
or you can get them from the UI as the Main technology process property.
If a value of the technologies property doesn't map to an existing one, the plugin will create a new tile on the Technology overview page. The Favicon property determines the technology tile displayed on the page:
Version
You can't deploy the same plugin version twice. To upload a modified plugin, make sure you increment the plugin version with every build or upload.
Name
ActiveGate plugin name should follow ^ custom.remote.python (\.[a-zA-Z0-9_]+)+$ regex. For example, custom.remote.python.demo. The name of each plugin must be unique.
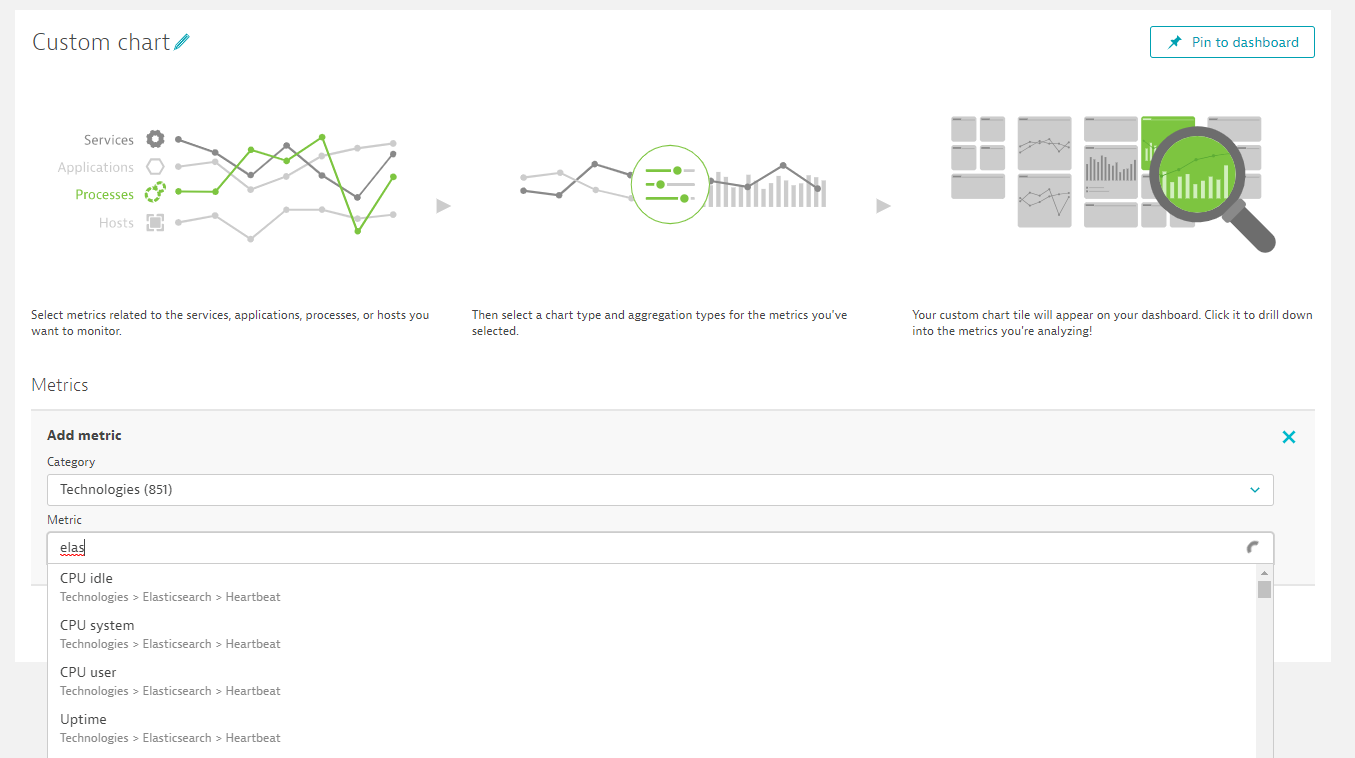
Metric Group
The preferred way of using Metric Group is adding prefix "tech" before your metric group definition. For example "tech.elasticsearch". Thanks to this, other users will be able to find additional metrics alongside with others in the context of technology like in this example on Custom Charts page:
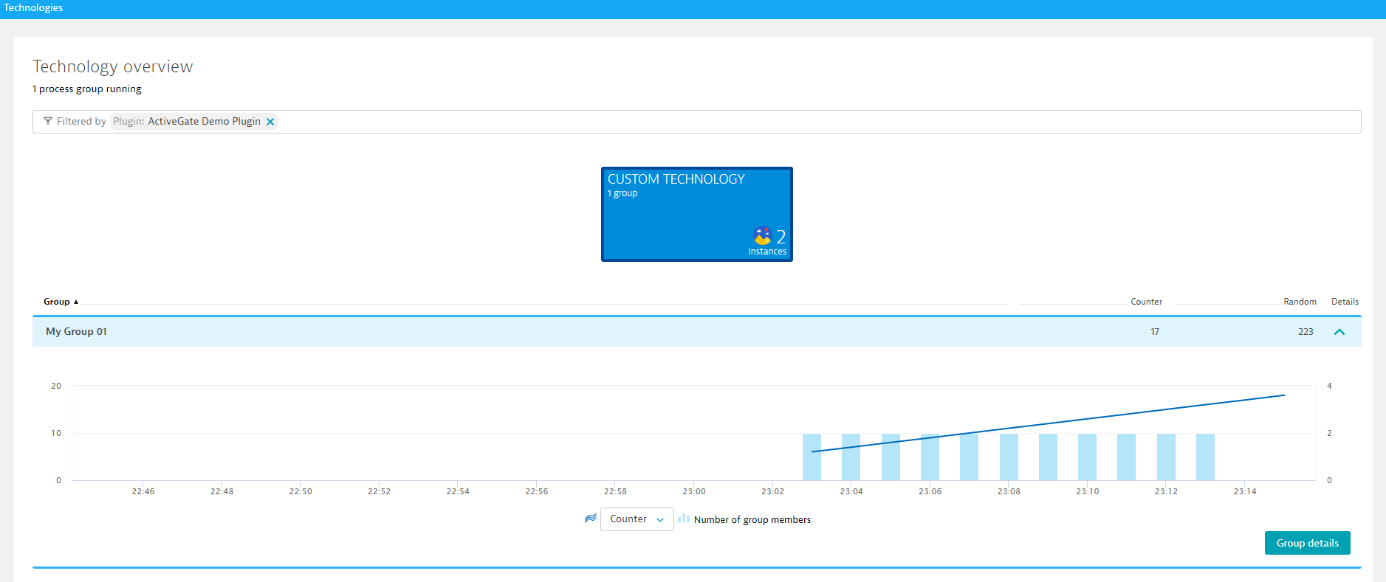
MetricGroup field can be also used to create a completely new entry. Note that you can use dots to create subgroups, like in this example "My_Metrics.plugins":
However, setting metricGroup field is not necessary for already running plugins that originally didn't have is set. In such a case, metricGroup will be automatically set the plugin name not to break the continuity of your data.
UI
This part of the JSON defines how metrics are charted on the DESK page. It contains an optional charts section and an optional keycharts section.
Example UI section:
Demo ui JSON
{
    "ui" :
    {
    "keymetrics" : [
      {
        "key": "databases.table_size",
        "aggregation": "max",
        "mergeaggregation": "sum",
        "displayname": "Total table size"
      }
    ],
    "keycharts" : [
        {
            "group": "Service state",
            "title": "State",
            "series": [
            {
                "key": "service.state_5",
                "displayname": "Status",
                "seriestype": "bar",
                "statecolors": ["#ff3333", "#ffd633", "#00b33c"],
                "statechart": true
            }]
        },
        {
            "group": "Disk usage",
            "title": "Total disk usage",
            "series": [
            {
                "key": "databases.table_size",
                "displayname": "Sum of databases size",
                "seriestype": "area",
                "color": "#74cff7"
            }]
        }
        ],
    "charts" : [
      {
        "group": "Memory",
        "title": "Per table usage",
        "series": [
            {
                "key": "databases.table_size",
                "displayname": "Per table size",
                "seriestype": "area",
                "color": "#74cff7",
                "metricexplanation": "How big is each table"
            }
        ]
      },
       {
        "group": "Entries",
        "title": "Total num entries",
        "series": [
            {
                "key": "databases.total_num_entities",
                "displayname": "Total number of entries",
                "seriestype": "line",
                "color": "#74cff7",
                "metricexplanation": "How big is each table"
            }
        ]
      },
      {
        "group": "Entries",
        "title": "Archives",
        "series": [
            {
                "key": "databases.replicated_entries",
                "displayname": "Number of entries archived",
                "seriestype": "bar",
                "color": "#74cff7",
                "metricexplanation": "Number of metrics moved to archive"
            }
        ]
      },
      {
        "group": "Connections",
        "title": "Archives",
        "series": [
            {
                "key": "service.querries_per_second",
                "displayname": "Connections per second",
                "seriestype": "bar",
                "color": "#74cff7",
                "metricexplanation": "Connections per second"
            }
        ]
      }
    ]
  }
}
UI Section
| Field | Type | Required | Description | Validation |
|---|---|---|---|---|
| keyMetrics | array of objects | False | maxItems: 2 | |
| keycharts | array of objects | False | Charts in first chart group in CD instance | |
| charts | array of objects | False | Visible in CD instance, in it's own defined group |
KeyMetrics
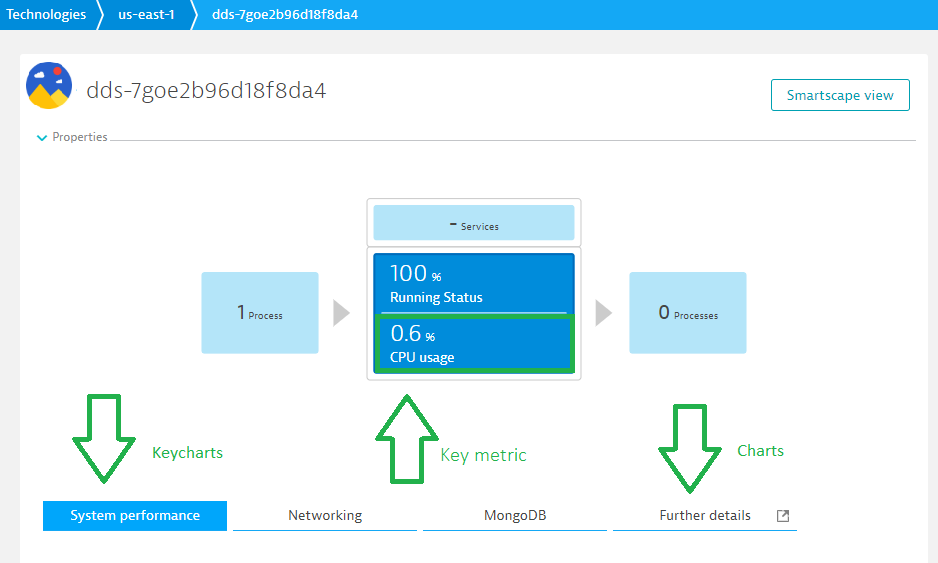
The KeyMetrics section is optional and allows you to define up to two metrics that should be part of the Custom Device infographic.
Demo keymetrics JSON
{
    [
        {
            "key": "databases.table_size",
            "aggregation": "max",
            "mergeaggregation": "sum",
            "displayname": "Total table size"
        }
    ]
}
Here is an example of a keymetric in web UI:
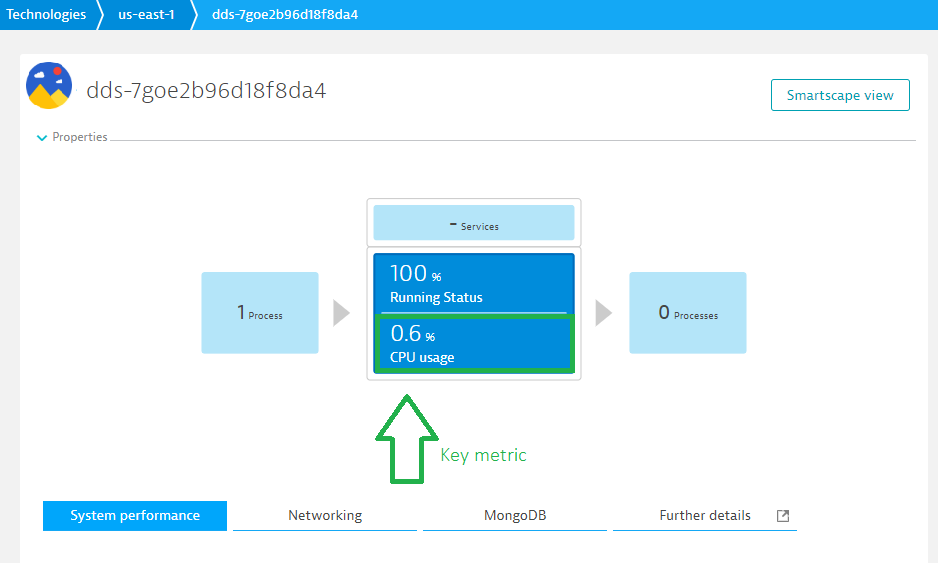
A keymetric has the following attributes:
keyMetrics
Array item definition:
| Field | Type | Required | Description | Validation |
|---|---|---|---|---|
| key | string | True | minLength: 1 | |
| aggregation | string | False | Aggregation type | enum: ['MIN', 'MAX', 'AVG', 'SUM', 'COUNT', 'P50', 'P90', 'min', 'max', 'avg', 'sum', 'count', 'p50', 'p90', 'Min', 'Max', 'Avg', 'Sum', 'Count'] |
| mergeaggregation | string | False | enum: ['MIN', 'MAX', 'AVG', 'SUM', 'min', 'max', 'avg', 'sum', 'Min', 'Max', 'Avg', 'Sum'] | |
| displayname | string | False | minLength: 1 | |
| unit | string | False | enum: ['NanoSecond', 'MicroSecond', 'MilliSecond', 'Second', 'Byte', 'KiloByte', 'KibiByte', 'MegaByte', 'MebiByte', 'BytePerSecond', 'BytePerMinute', 'KiloBytePerSecond', 'KiloBytePerMinute', 'KibiBytePerSecond', 'KibiBytePerMinute', 'MegaBytePerSecond', 'MegaBytePerMinute', 'MebiBytePerSecond', 'MebiBytePerMinute', 'Ratio', 'Percent', 'Promille', 'Count', 'PerSecond', 'PerMinute', 'Unspecified', 'NotApplicable'] |
KeyCharts
Both KeyCharts and Charts have the same object structure, for example:
Demo keycharts JSON
    "keycharts" : [
        {
            "group": "Service state",
            "title": "State",
            "series": [
            {
                "key": "service.state_5",
                "displayname": "Status",
                "seriestype": "bar",
                "statecolors": ["#ff3333", "#ffd633", "#00b33c"],
                "statechart": true
            }]
        },
        {
            "group": "Disk usage",
            "title": "Total disk usage",
            "series": [
            {
                "key": "databases.table_size",
                "displayname": "Sum of databases size",
                "seriestype": "area",
                "color": "#74cff7"
            }]
        }
        ],
Keycharts are visible on each Process page:
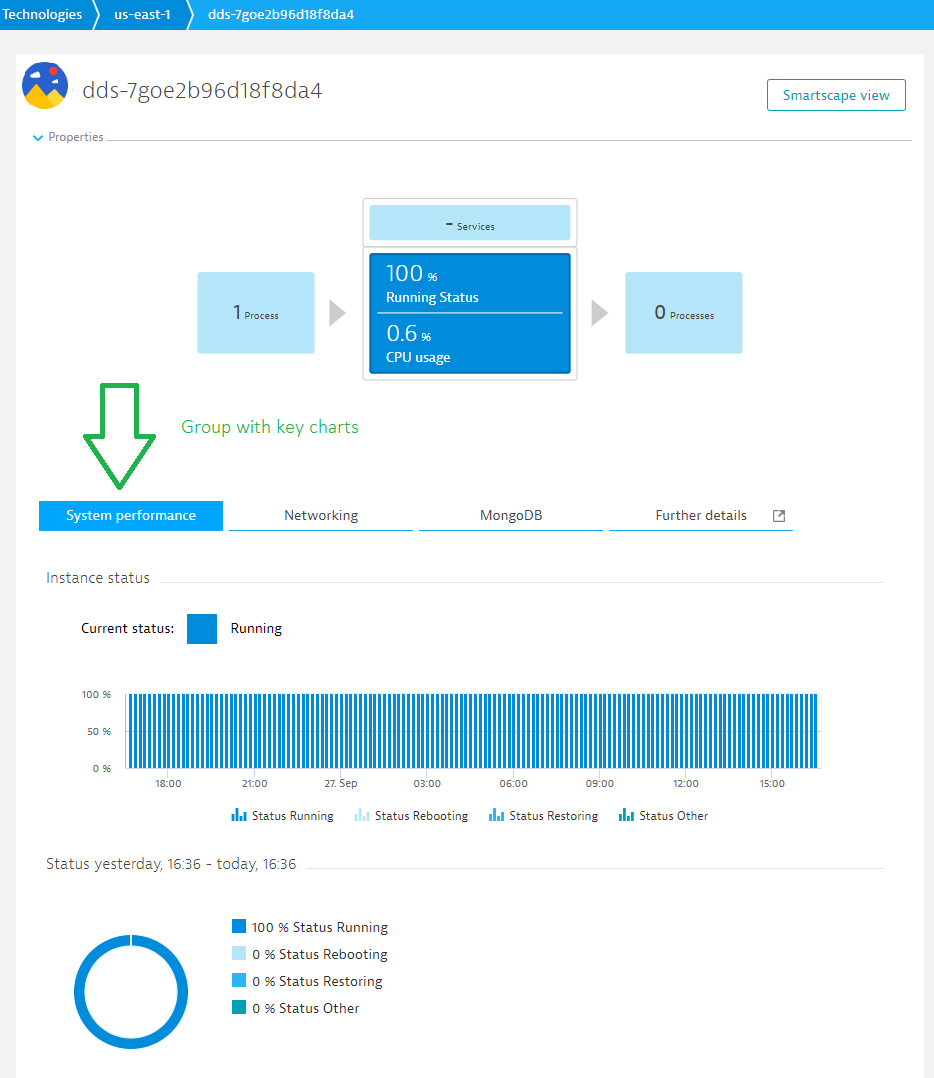
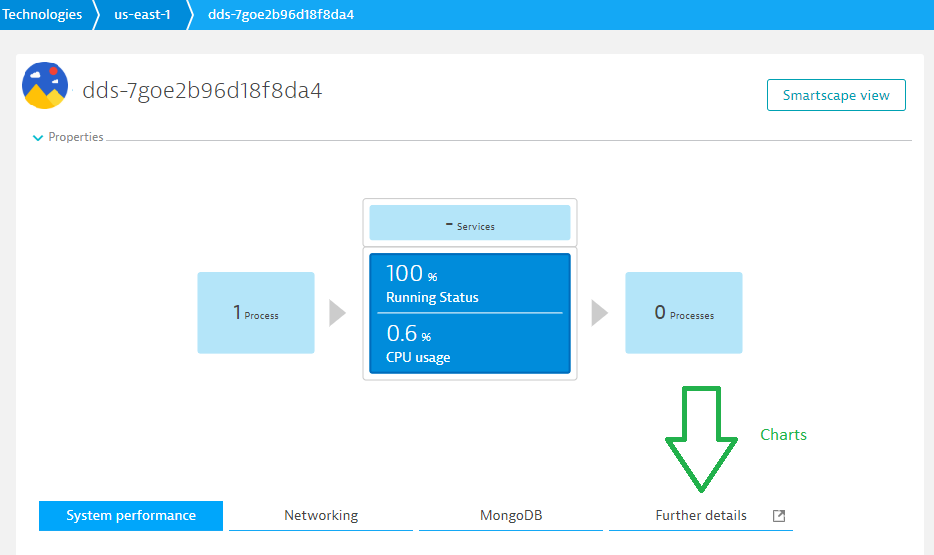
Charts
Other charts are available after drilling down to the Further details section of each Process page.
Both chart and keychart sections are an array of objects:
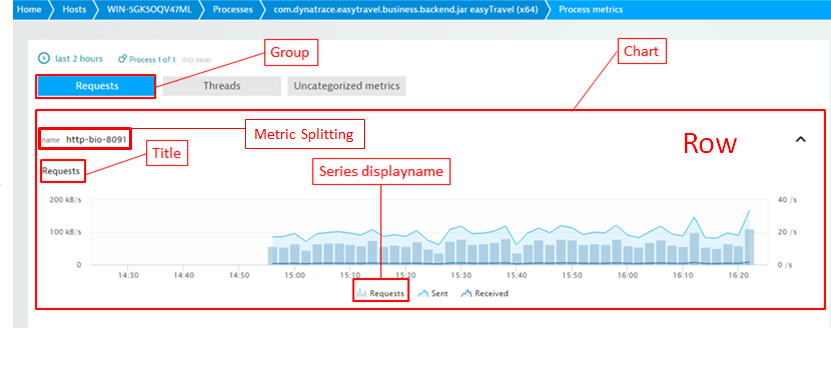
Chart
Array item definition:
| Field | Type | Required | Description | Validation |
|---|---|---|---|---|
| title | string | True | minLength: 1 | |
| description | string | False | minLength: 1 | |
| group | string | True | minLength: 1 | |
| series | array of objects | True |
Where series is an array of objects:
series
Array item definition:
| Field | Type | Required | Description | Validation |
|---|---|---|---|---|
| key | string | True | minLength: 1 | |
| color | string | False | ||
| aggeragation | string | False | enum: ['MIN', 'MAX', 'AVG', 'SUM', 'COUNT', 'P50', 'P90', 'min', 'max', 'avg', 'sum', 'count', 'p50', 'p90', 'Min', 'Max', 'Avg', 'Sum', 'Count'] | |
| mergeaggregation | string | False | enum: ['MIN', 'MAX', 'AVG', 'SUM', 'min', 'max', 'avg', 'sum', 'Min', 'Max', 'Avg', 'Sum'] | |
| dimensions | array of strings | False | ||
| seriestype | string | False | How will given series render in DESK UI | enum: ['LINE', 'AREA', 'BAR', 'line', 'area', 'bar', 'Line', 'Area', 'Bar'] |
| stacked | boolean | False | ||
| rightaxis | boolean | False | ||
| displayname | string | False | minLength: 1 | |
| unit | string | False | minLength: 1 |
Metrics
This part of the JSON is an array and defines which metrics are fetched by the plugin. Each metric is defined by independently by JSON. There are two types of metrics avaiable: timeseries and statetimeseries
Demo metrics JSON
[
    { "statetimeseries": {"key": "service.state_5", "states": ["DOWNTIME", "MAINTENANCE", "WORKING"], "displayname": "Service State", "source": {"state_entrypoint": "/api/state" }}, "entity": "CUSTOM_DEVICE"},
    {
      "timeseries": { "key": "service.querries_per_second", "unit":"PerSecond", "displayname": "Querries per second", "aggregation": "AVG"},
      "entity": "CUSTOM_DEVICE_GROUP",
      "alert_settings": [{
        "alert_id": "custom_connections_alert",
        "event_type": "AVAILABILITY_EVENT",
        "event_name": "No connections!",
        "description": "The {metricname} of {severity} is {alert_condition} the threshold of {threshold}",
        "threshold": 0.01,
        "alert_condition": "ABOVE",
        "samples":5,
        "violating_samples":1,
        "dealerting_samples":5
      }]
    },
    { "timeseries": { "key": "databases.table_size", "unit":"MegaByte", "displayname": "Table size", "aggregation": "MAX", "dimensions": ["table_name"]}, "entity": "CUSTOM_DEVICE"},
    { "timeseries": { "key": "databases.total_num_entities", "unit": "Count", "displayname": "Total num ", "aggregation": "MAX" }, "entity": "CUSTOM_DEVICE"},
    { "timeseries": { "key": "databases.replicated_entries", "unit": "Count", "displayname": "Archived Entries", "aggregation": "SUM" }, "entity": "CUSTOM_DEVICE"}

  ]
Metrics section
Array item have to match one of:
| Field | Type | Required | Description | Validation |
|---|---|---|---|---|
| timeseries | object | True | Timeseries definition | |
| entity | string | False | enum: ['CUSTOM_DEVICE', 'CUSTOM_DEVICE_GROUP'] | |
| alert_settings | array of objects | False | ||
| source | object | False | Can be used to specify any valid JSON structure, to be processed by the Plugin. |
| Field | Type | Required | Description | Validation |
|---|---|---|---|---|
| statetimeseries | object | True | Statetimeseries definition | |
| entity | string | False | enum: ['CUSTOM_DEVICE', 'CUSTOM_DEVICE_GROUP'] | |
| alert_settings | array of objects | False |
Where timeseries and statetimeseries are defined as:
Timeseries
| Field | Type | Required | Description | Validation |
|---|---|---|---|---|
| key | string | True | Metric name specification | minLength: 1, pattern: ^([a-zA-Z][a-zA-Z0-9_-]*)(.[a-zA-Z][a-zA-Z0-9_-]*)*$ |
| unit | string | True | Metric unit. See the link for available units. | enum: ['NanoSecond', 'MicroSecond', 'MilliSecond', 'Second', 'Byte', 'KiloByte', 'KibiByte', 'MegaByte', 'MebiByte', 'BytePerSecond', 'BytePerMinute', 'KiloBytePerSecond', 'KiloBytePerMinute', 'KibiBytePerSecond', 'KibiBytePerMinute', 'MegaBytePerSecond', 'MegaBytePerMinute', 'MebiBytePerSecond', 'MebiBytePerMinute', 'Ratio', 'Percent', 'Promille', 'Count', 'PerSecond', 'PerMinute', 'Unspecified', 'NotApplicable'] |
| aggregation | string | False | Time series data point aggregation | enum: ['min', 'max', 'avg', 'sum', 'count', 'MIN', 'MAX', 'AVG', 'SUM', 'COUNT', 'Min', 'Max', 'Avg', 'Sum', 'Count'] |
| dimensions | array of strings | False | Dimensions are used to provide 1 metric per plugin ObjectName key property value. For example, version, service, or database. Dimension "rx_pid" at index 0 means the system process ID (PID). | |
| displayname | string | True | The name under which the metric will be displayed. | minLength: 1 |
Statetimeseries
| Field | Type | Required | Description | Validation |
|---|---|---|---|---|
| key | string | True | Metric name specification | minLength: 1, pattern: ^([a-zA-Z][a-zA-Z0-9_-]*)(.[a-zA-Z][a-zA-Z0-9_-]*)*$ |
| dimensions | array of strings | False | ||
| states | array of strings | True | ||
| displayname | string | True | minLength: 1 | |
| source | object | False | Can be used to specify any valid JSON structure, to be processed by the Plugin. |
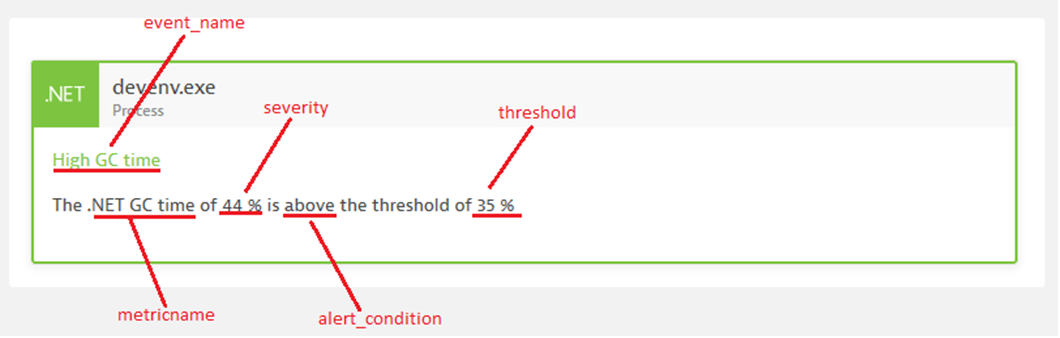
Alerts
Both timeseries and statetimeseries can define alerts. To do it, use the alert_settings which is an array of objects, where each object looks like:
Demo alert JSON
{
    "alert_id": "custom_connections_alert",
    "event_type": "AVAILABILITY_EVENT",
    "event_name": "No connections!",
    "description": "The {metricname} of {severity} is {alert_condition} the threshold of {threshold}",
    "threshold": 0.01,
    "alert_condition": "ABOVE",
    "samples":5,
    "violating_samples":1,
    "dealerting_samples":5
}
Alert
Array item definition:
| Field | Type | Required | Description | Validation |
|---|---|---|---|---|
| alert_id | string | True | Metric name specification | minLength: 1, pattern: ^([a-zA-Z][a-zA-Z0-9_-]*)(.[a-zA-Z][a-zA-Z0-9_-]*)*$ |
| event_type | string | True | Event type | enum: ['PERFORMANCE_EVENT', 'AVAILABILITY_EVENT', 'ERROR_EVENT'] |
| description | string | False | Description defines alert message, following code snippets could be used: {threshold} the value of the custom threshold that was violated {severity} the violating value {entityname} the display name of the entity where the metric violated {violating_samples} the number of violating samples that led to that event {dimensions} a string containg the violating dimensions of the metric {alert_condition} a string showing if above or below threshold is alerting | |
| alert_condition | string | True | Alert condition | enum: ['ABOVE', 'BELOW'] |
| event_name | string | True | Event name displayed on UI pages. | minLength: 1 |
| threshold | number | True | The value of the threshold. | |
| samples | integer | True | Size of the "window" in which violating_samples are counted. | |
| violating_samples | integer | True | The number of violating samples that rise an alert. Must be less that samples. | |
| dealerting_samples | integer | True | The number of not violating samples that deactivate and alert. Must be less that samples. |
Configuration
The plugin configuration section controls the plugin data appearance in the web UI at Settings > Monitored technologies and its configuration, for example: user name, password, connection string, etc. The configUI section defines the configuration fields that are displayed in the UI. The properties section defines the configuration properties that are sent to the plugin.
ConfigUI
Example ConfigUI section:
Demo configui JSON
{
    "configUI" :{
        "displayName": "CustomCloudTechnology",
        "properties" : [
            { "key" : "url", "displayName": "URL", "displayOrder": 3, "displayHint": "http://localhost:9200/" },
            { "key" : "auth_user", "displayName": "User", "displayOrder": 1, "displayHint": "Leave empty if no authentication is set up" },
            { "key" : "auth_password", "displayName": "Password", "displayOrder": 2, "displayHint": "Leave empty if no authentication is set up", "defaultValue": "somepassword"},
            { "key" : "state_interval", "displayName": "State change interval", "displayOrder": 3, "displayHint": "How often state metrics changes", "defaultValue": 60},
            { "key" : "alert_interval", "displayName": "Alert interval", "displayOrder": 4, "displayHint": "How often an alert is raised", "defaultValue": 360},
            { "key" : "event_interval", "displayName": "Event interval", "displayOrder": 5, "displayHint": "How often an event is raised", "defaultValue": 240},
            { "key" : "relative_interval", "displayName": "Relative interval", "displayOrder": 6, "displayHint": "How often relative metric is submitted", "defaultValue": 60}
        ]
     }
}
This is how it will manifest in Monitored Technologies:
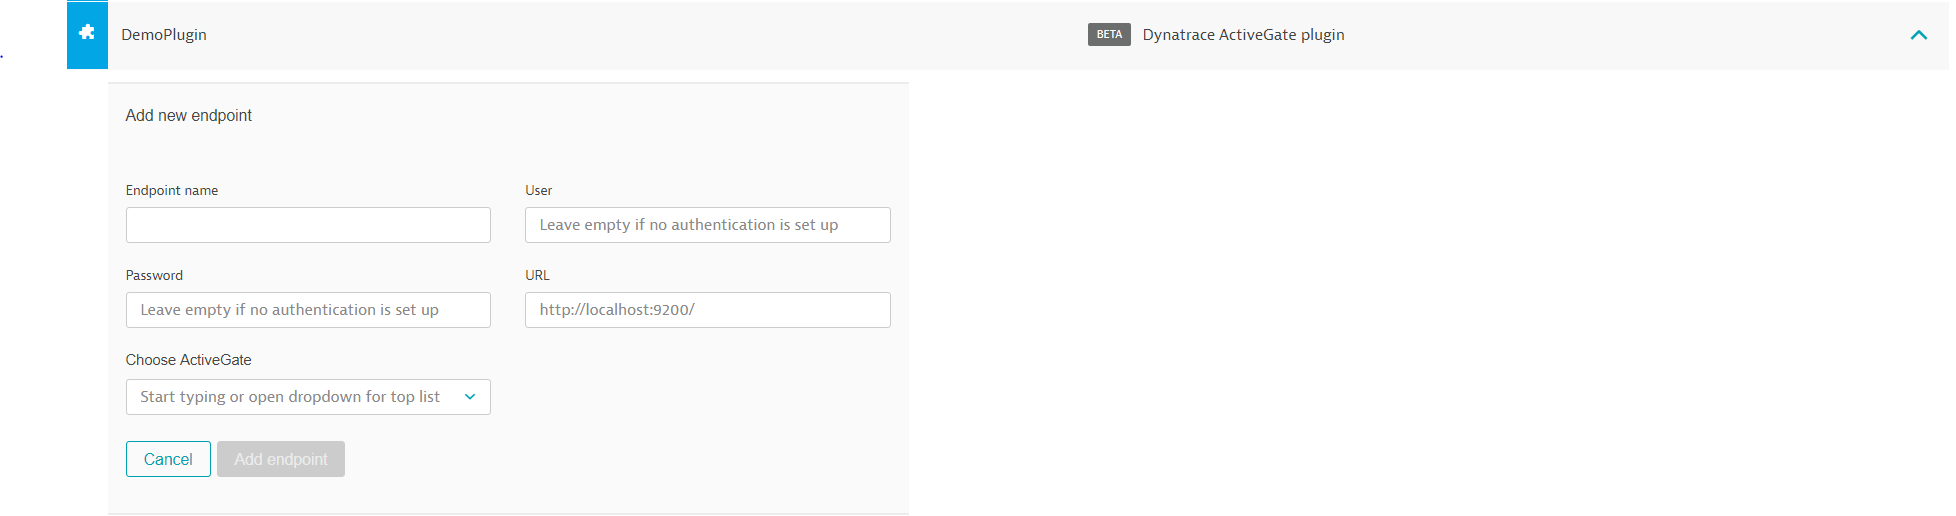
Note the two additional fields: Endpoint and Choose ActiveGate. Endpoint is a CustomDevice name and Choose ActiveGate is a dropdown of all avaiable ActiveGate PluginModules - select the on you want to use to execute the plugin.
ConfigUI is an array of objects:
Config UI section
| Field | Type | Required | Description | Validation |
|---|---|---|---|---|
| displayName | string | False | Human readable plugin name. This name is displayed in web UI at Settings > Monitored technologies > Custom plugins once the plugin is uploaded. | minLength: 1 |
| properties | array of objects | False |
Properties is an array of objects that are used to define fields for plugin cofiguration page:
ConfigUI properties
Array item definition:
| Field | Type | Required | Description | Validation |
|---|---|---|---|---|
| key | string | True | Config property key, needs to match key from configUI properties section | minLength: 1 |
| displayName | string | True | Human readable property name. | minLength: 1 |
| displayOrder | integer | False | Determines display order on plugin configuration tile. | |
| displayHint | string | False | Hint displayed in the tool-tip. |
Properties
Example Properties section:
Demo properties JSON
{
    "properties" : [
    {
      "key": "url",
      "type": "String"
    },
    {
      "key": "auth_user",
      "type": "String"
    },
    {
      "key": "auth_password",
      "type": "Password"
    },
    {
      "key": "state_interval",
      "type": "Integer",
      "defaultValue": 60
    },
    {
      "key": "alert_interval",
      "type": "Integer",
      "defaultValue": 360
    },
    {
      "key": "event_interval",
      "type": "Integer",
      "defaultValue": 240
    },
    {
      "key": "relative_interval",
      "type": "Integer",
      "defaultValue": 60
    }
  ]
}
Properties is an array of objects:
Plugin properties
Array item definition:
| Field | Type | Required | Description | Validation |
|---|---|---|---|---|
| key | string | True | Property key. Must be unique within this plugin and must match the key from configUI properties. | minLength: 1 |
| type | string | True | For 'PASSWORD' stars will be displayed while typing. | enum: ['STRING', 'BOOLEAN', 'INTEGER', 'FLOAT', 'PASSWORD', 'JSON', 'TEXTAREA', 'DROPDOWN', 'string', 'boolean', 'integer', 'float', 'password', 'json', 'textarea', 'dropdown', 'String', 'Boolean', 'Integer', 'Float', 'Password', 'Json', 'Textarea', 'Dropdown'] |
| defaultValue | string | False | Default value. |