Metric events anomaly detection API - POST an event
Creates a new metric event rule.
The request consumes and produces an application/json payload.
This request is an early adopter release and may be changed in non compatible way.
| POST |
|
Parameters
| Parameter | Type | Description | In | Required |
|---|---|---|---|---|
| body | MetricEvent |
The JSON body of the request. Contains parameters of the new metric event. |
body | optional |
The MetricEvent object
The configuration of the metric event.
| Element | Type | Description | Required |
|---|---|---|---|
| metadata | ConfigurationMetadata |
Metadata useful for debugging. |
optional |
| id | string |
The ID of the metric event. |
optional |
| metricId | string |
The ID of the metric evaluated by the metric event. |
required |
| name | string |
The name of the metric event displayed in the UI. |
required |
| description | string |
The description of the metric event. |
required |
| aggregationType | string |
How the metric data points are aggregated for the evaluation. The timeseries must support this aggregation. The aggregationType element can hold these values. |
optional |
| severity | string |
The type of the event to trigger on the threshold violation. The |
optional |
| alertCondition | string |
The condition for the threshold value check: above or below. The alertCondition element can hold these values. |
required |
| samples | integer |
The number of one-minute samples that form sliding evaluation window. |
required |
| violatingSamples | integer |
The number of one-minute samples within the evaluation window that must violate the threshold to trigger an event |
required |
| dealertingSamples | integer |
The number of one-minute samples within the evaluation window that must go back to normal to close the event. |
required |
| threshold | number |
The value of the threshold. |
required |
| enabled | boolean |
The metric event is enabled ( |
required |
| alertingScope | MetricEventAlertingScope[] |
Defines the scope of the metric event. |
optional |
| metricDimensions | MetricEventDimensions[] |
Defines the dimensions of the metric to alert on. |
optional |
| unit | string |
The unit of the threshold, matching the metric definition. If not set the metrics unit is picked. The unit element can hold these values. |
optional |
The MetricEventDimensions object
A single filter for the metrics dimensions.
This is the base version of the filter, depending on the type, the actual JSON may contain additional fields.
| Element | Type | Description | Required |
|---|---|---|---|
| filterType | string |
Defines the actual set of fields depending on the value: ENTITY -> MetricEventEntityDimensions STRING -> MetricEventStringDimensions The filterType element can hold these values. |
required |
| name | string |
The dimensions name. Sending this has no effect while creating a configuration, as only the index of the dimension is used here -> dimension names might change, indexes not. |
optional |
| index | integer |
The dimensions index on the metric. |
required |
The MetricEventAlertingScope object
A single filter for the alerting scope.
This is the base version of the filter, depending on the type, the actual JSON may contain additional fields.
| Element | Type | Description | Required |
|---|---|---|---|
| filterType | string |
Defines the actual set of fields depending on the value: ENTITY_ID -> EntityIdAlertingScope MANAGEMENT_ZONE -> ManagementZoneAlertingScope TAG -> TagFilterAlertingScope NAME -> NameAlertingScope CUSTOM_DEVICE_GROUP_NAME -> CustomDeviceGroupNameAlertingScope HOST_GROUP_NAME -> HostGroupNameAlertingScope HOST_NAME -> HostNameAlertingScope PROCESS_GROUP_ID -> ProcessGroupIdAlertingScope PROCESS_GROUP_NAME -> ProcessGroupNameAlertingScope The filterType element can hold these values. |
required |
The ConfigurationMetadata object
Metadata useful for debugging
| Element | Type | Description | Required |
|---|---|---|---|
| configurationVersions | integer[] |
A Sorted list of the version numbers of the configuration. |
optional |
| clusterVersion | string |
DESK server version. |
optional |
This is a model of the request body, showing the possible elements. It has to be adjusted for usage in an actual request. See the Example expandable section for working sample request.
  {
  "metadata": {
    "configurationVersions": [
      4,
      2
    ],
    "clusterVersion": {
      "major": 0,
      "minor": 0,
      "revision": 0,
      "sourceRevision": "",
      "timestamp": ""
    }
  },
  "metricId": "com.DESK.builtin:host.disk.bytesread",
  "name": "My metric event",
  "description": "This is the description for my metric event.\n",
  "aggregationType": "AVG",
  "severity": "CUSTOM_ALERT",
  "alertCondition": "ABOVE",
  "samples": 5,
  "violatingSamples": 3,
  "dealertingSamples": 5,
  "threshold": 80,
  "alertingScope": [
    {
      "filterType": "ENTITY_ID",
      "entityId": "HOST-000000000001E240"
    },
    {
      "filterType": "TAG",
      "tagFilter": {
        "context": "CONTEXTLESS",
        "key": "someKey",
        "value": "someValue"
      }
    }
  ],
  "metricDimensions": [
    {
      "filterType": "ENTITY",
      "name": "disk",
      "index": 1,
      "nameFilter": {
        "value": "diskName",
        "operator": "EQUALS"
      }
    }
  ],
  "enabled": true,
  "unit": "KILO_BYTE_PER_SECOND"
}
Possible values
Possible values for the unit element in the MetricEvent object:
- BIT
- BIT_PER_HOUR
- BIT_PER_MINUTE
- BIT_PER_SECOND
- BYTE
- BYTE_PER_HOUR
- BYTE_PER_MINUTE
- BYTE_PER_SECOND
- CORES
- COUNT
- GIBI_BYTE
- GIGA_BYTE
- HOUR
- KIBI_BYTE
- KIBI_BYTE_PER_HOUR
- KIBI_BYTE_PER_MINUTE
- KIBI_BYTE_PER_SECOND
- KILO_BYTE
- KILO_BYTE_PER_HOUR
- KILO_BYTE_PER_MINUTE
- KILO_BYTE_PER_SECOND
- MEBI_BYTE
- MEBI_BYTE_PER_HOUR
- MEBI_BYTE_PER_MINUTE
- MEBI_BYTE_PER_SECOND
- MEGA_BYTE
- MEGA_BYTE_PER_HOUR
- MEGA_BYTE_PER_MINUTE
- MEGA_BYTE_PER_SECOND
- MICRO_SECOND
- MILLI_CORES
- MILLI_SECOND
- MILLI_SECOND_PER_MINUTE
- MINUTE
- NANO_SECOND
- NANO_SECOND_PER_MINUTE
- NOT_APPLICABLE
- PERCENT
- PER_HOUR
- PER_MINUTE
- PER_SECOND
- PROMILLE
- RATIO
- SECOND
- STATE
- UNSPECIFIED
Possible values for the filterType element in the MetricEventDimensions object:
- ENTITY
- STRING
Possible values for the filterType element in the MetricEventAlertingScope object:
- ENTITY_ID
- MANAGEMENT_ZONE
- TAG
- NAME
- CUSTOM_DEVICE_GROUP_NAME
- HOST_GROUP_NAME
- HOST_NAME
- PROCESS_GROUP_ID
- PROCESS_GROUP_NAME
Possible values for the alertCondition element in the MetricEvent object:
- ABOVE
- BELOW
Possible values for the severity element in the MetricEvent object:
- AVAILABILITY
- CUSTOM_ALERT
- ERROR
- INFO
- PERFORMANCE
- RESOURCE_CONTENTION
Possible values for the aggregationType element in the MetricEvent object:
- AVG
- COUNT
- MAX
- MEDIAN
- MIN
- OF_INTEREST
- OF_INTEREST_RATIO
- OTHER
- OTHER_RATIO
- P90
- SUM
- VALUE
Response format
The EntityShortRepresentation object
The short representation of a DESK entity.
| Element | Type | Description |
|---|---|---|
| id | string | The ID of the DESK entity. |
| name | string | The name of the DESK entity. |
| description | string | A short description of the DESK entity. |
{}
Validate payload
We recommend that you validate the payload before submitting it with an actual request. A response code of 204 indicates a valid payload.
The request consumes an application/json payload.
This request is an early adopter release and may be changed in non compatible way.
| POST |
|
Response codes
| Code | Description |
|---|---|
| 204 | Validated. The submitted configuration is valid. Response doesn't have a body. |
| 400 | Failed. The input is invalid. |
Example
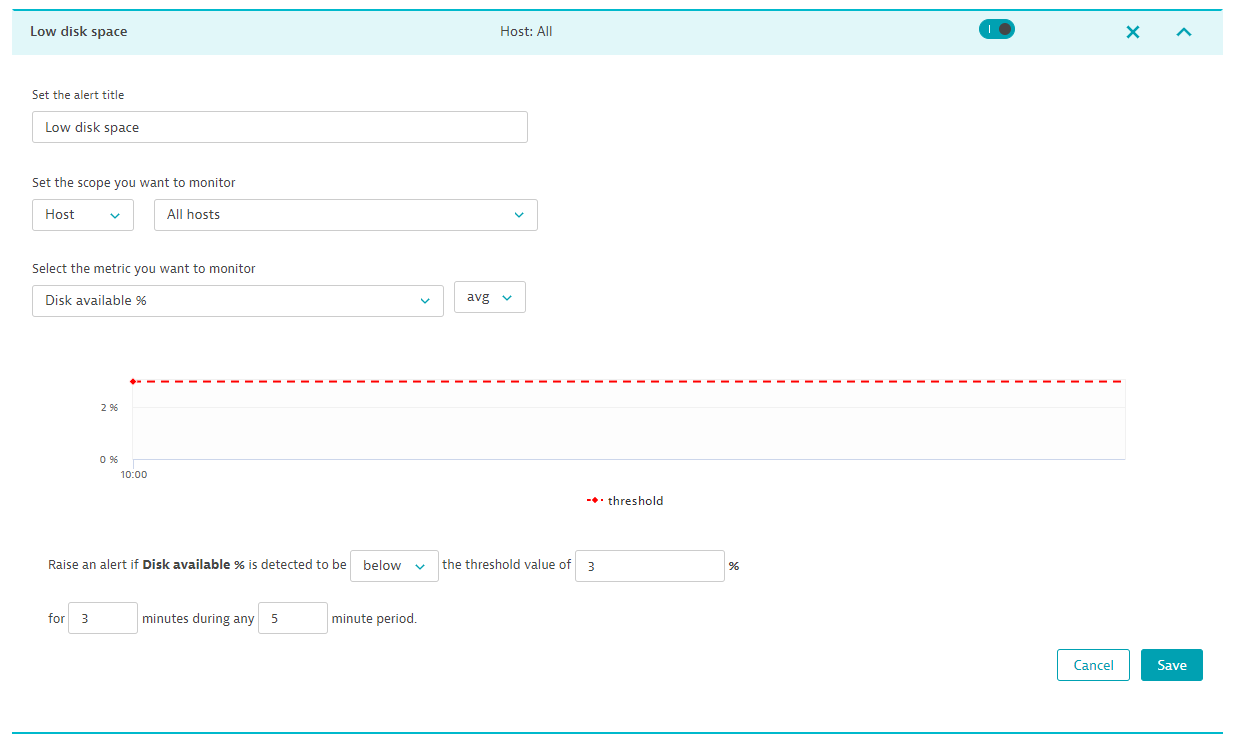
In this example, the request creates a custom alert that triggers if free disk space drops below 3% in 3 out of 5 samples. The scope of the alert is all hosts.
The API token is passed in the Authorization header.
You can download or copy the example request body to try it out on your own.
Curl
curl -X POST \
  https://mySampleEnv.live.dexp.ae/api/config/v1/anomalyDetection/metricEvents \
  -H 'Authorization: Api-token abcdefjhij1234567890' \
  -H 'Content-Type: application/json' \
  -d '{
  "metricId": "com.DESK.builtin:host.disk.freespacepercentage",
  "name": "Low disk space",
  "description": "The available disk space is below 3%",
  "aggregationType": "AVG",
  "eventType": "CUSTOM_ALERT",
  "alertCondition": "BELOW",
  "samples": 5,
  "violatingSamples": 3,
  "dealertingSamples": 5,
  "threshold": 3,
  "enabled": true,
  "tagFilters": []
}
'
Request URL
https://mySampleEnv.live.dexp.ae/api/config/v1/anomalyDetection/metricEvents
Request body
api-examples/config/anomaly-detection/metric-events/post-config.json
{
  "metricId": "com.DESK.builtin:host.disk.freespacepercentage",
  "name": "Low disk space",
  "description": "The available disk space is below 3%",
  "aggregationType": "AVG",
  "eventType": "CUSTOM_ALERT",
  "alertCondition": "BELOW",
  "samples": 5,
  "violatingSamples": 3,
  "dealertingSamples": 5,
  "threshold": 3,
  "enabled": true,
  "tagFilters": []
}
Response body
{
  "id": "1b06b18a-82df-4e18-a4aa-d4543b227734",
  "name": "Low disk space",
  "description": "The available disk space is below 3%"
}
Response code
204
Result
The new rule looks like this in the UI: