Services anomaly detection API - PUT configuration
Updates the configuration of anomaly detection for services.
The request consumes an application/json payload.
| PUT |
|
Parameters
| Parameter | Type | Description | In | Required |
|---|---|---|---|---|
| body | ServiceAnomalyDetectionConfig |
The JSON body of the request. Contains parameters of the service anomaly detection configuration. |
body | optional |
The ServiceAnomalyDetectionConfig object
DESK automatically detects service-related performance anomalies such as response time degradations and failure rate increases. Use these settings to configure detection sensitivity, set alert thresholds, or disable alerting for certain services.
| Element | Type | Description | Required |
|---|---|---|---|
| metadata | ConfigurationMetadata |
Metadata useful for debugging. |
optional |
| responseTimeDegradation | ResponseTimeDegradationDetectionConfig |
How to detect response time degradation. |
required |
| failureRateIncrease | FailureRateIncreaseDetectionConfig |
How to detect failure rate increase. |
required |
The FailureRateIncreaseDetectionConfig object
Configuration of failure rate increase detection.
| Element | Type | Description | Required |
|---|---|---|---|
| detectionMode | string |
How to detect failure rate increase: automatically, or based on fixed thresholds, or do not detect. The detectionMode element can hold these values. |
required |
| automaticDetection | FailureRateIncreaseAutodetectionConfig |
Parameters of automatic failure rate increase detection. Required if detectionMode is The absolute and relative thresholds both must be exceeded to trigger an alert. Example: If the expected error rate is 1.5%, and you set an absolute increase of 1%, and you set a relative increase of 50%, the thresholds will be: Absolute: 1.5% + 1% = 2.5% Relative: 1.5% + 1.5% * 50% = 2.25% |
optional |
| thresholds | FailureRateIncreaseThresholdConfig |
Fixed thresholds for failure rate increase detection. Required if the detectionMode is |
optional |
The FailureRateIncreaseThresholdConfig object
Fixed thresholds for failure rate increase detection.
Required if detectionMode is DETECT_USING_FIXED_THRESHOLDS. Not applicable otherwise.
| Element | Type | Description | Required |
|---|---|---|---|
| threshold | integer |
Failure rate during any 5-minute period to trigger an alert, %. |
required |
| sensitivity | string |
Sensitivity of the threshold. With With |
required |
The FailureRateIncreaseAutodetectionConfig object
Parameters of failure rate increase auto-detection. Required if detectionMode is DETECT_AUTOMATICALLY. Not applicable otherwise.
The absolute and relative thresholds both must exceed to trigger an alert.
Example: If the expected error rate is 1.5%, and you set an absolute increase of 1%, and a relative increase of 50%, the thresholds will be: Absolute: 1.5% + 1% = 2.5% Relative: 1.5% + 1.5% * 50% = 2.25%
| Element | Type | Description | Required |
|---|---|---|---|
| failingServiceCallPercentageIncreaseAbsolute | integer |
Absolute increase of failing service calls to trigger an alert, %. |
required |
| failingServiceCallPercentageIncreaseRelative | integer |
Relative increase of failing service calls to trigger an alert, %. |
required |
The ResponseTimeDegradationDetectionConfig object
Configuration of response time degradation detection.
| Element | Type | Description | Required |
|---|---|---|---|
| detectionMode | string |
How to detect response time degradation: automatically, or based on fixed thresholds, or do not detect. The detectionMode element can hold these values. |
required |
| automaticDetection | ResponseTimeDegradationAutodetectionConfig |
Parameters of automatic response time degradation detection. Required if detectionMode is Violation of any criterion triggers an alert. |
optional |
| thresholds | ResponseTimeDegradationThresholdConfig |
Fixed thresholds for response time degradation detection. Required if detectionMode is |
optional |
The ResponseTimeDegradationThresholdConfig object
Fixed thresholds for response time degradation detection.
Required if detectionMode is DETECT_USING_FIXED_THRESHOLDS. Not applicable otherwise.
| Element | Type | Description | Required |
|---|---|---|---|
| responseTimeThresholdMilliseconds | integer |
Response time during any 5-minute period to trigger an alert, in milliseconds. |
required |
| slowestResponseTimeThresholdMilliseconds | integer |
Response time of the 10% slowest during any 5-minute period to trigger an alert, in milliseconds. |
required |
| loadThreshold | string |
Minimal service load to detect response time degradation. Response time degradation of services with smaller load won't trigger alerts. The loadThreshold element can hold these values. |
required |
| sensitivity | string |
Sensitivity of the threshold. With With |
required |
The ResponseTimeDegradationAutodetectionConfig object
Parameters of the response time degradation auto-detection. Required if the detectionMode is DETECT_AUTOMATICALLY. Not applicable otherwise.
Violation of any criterion triggers an alert.
| Element | Type | Description | Required |
|---|---|---|---|
| responseTimeDegradationMilliseconds | integer |
Alert if the response time degrades by more than X milliseconds. |
required |
| responseTimeDegradationPercent | integer |
Alert if the response time degrades by more than X %. |
required |
| slowestResponseTimeDegradationMilliseconds | integer |
Alert if the response time of the slowest 10% degrades by more than X milliseconds. |
required |
| slowestResponseTimeDegradationPercent | integer |
Alert if the response time of the slowest 10% degrades by more than X %. |
required |
| loadThreshold | string |
Minimal service load to detect response time degradation. Response time degradation of services with smaller load won't trigger alerts. The loadThreshold element can hold these values. |
required |
The ConfigurationMetadata object
Metadata useful for debugging
| Element | Type | Description | Required |
|---|---|---|---|
| configurationVersions | integer[] |
A Sorted list of the version numbers of the configuration. |
optional |
| clusterVersion | string |
DESK server version. |
optional |
This is a model of the request body, showing the possible elements. It has to be adjusted for usage in an actual request. See the Example expandable section for working sample request.
  {
  "metadata": {
    "configurationVersions": [
      4,
      2
    ],
    "clusterVersion": {
      "major": 0,
      "minor": 0,
      "revision": 0,
      "sourceRevision": "",
      "timestamp": ""
    }
  },
  "responseTimeDegradation": {
    "detectionMode": "DETECT_AUTOMATICALLY",
    "automaticDetection": {
      "responseTimeDegradationMilliseconds": 250,
      "responseTimeDegradationPercent": 90,
      "slowestResponseTimeDegradationMilliseconds": 500,
      "slowestResponseTimeDegradationPercent": 200,
      "loadThreshold": "ONE_REQUEST_PER_MINUTE"
    }
  },
  "failureRateIncrease": {
    "detectionMode": "DETECT_USING_FIXED_THRESHOLDS",
    "thresholds": {
      "threshold": 10,
      "sensitivity": "LOW"
    }
  }
}
Possible values
Possible values for the sensitivity element in the ResponseTimeDegradationThresholdConfig object:
- HIGH
- LOW
- MEDIUM
Possible values for the loadThreshold element in the ResponseTimeDegradationAutodetectionConfig object:
- FIFTEEN_REQUESTS_PER_MINUTE
- FIVE_REQUESTS_PER_MINUTE
- ONE_REQUEST_PER_MINUTE
- TEN_REQUESTS_PER_MINUTE
Possible values for the detectionMode element in the ResponseTimeDegradationDetectionConfig object:
- DETECT_AUTOMATICALLY
- DETECT_USING_FIXED_THRESHOLDS
- DONT_DETECT
Response format
A successful request doesn't return any content.
Validate payload
We recommend that you validate the payload before submitting it with an actual request. A response code of 204 indicates a valid payload.
The request consumes an application/json payload.
| POST |
|
Response codes
| Code | Description |
|---|---|
| 204 | Validated. The submitted configuration is valid. Response doesn't have a body. |
| 400 | Failed. The input is invalid. |
Example
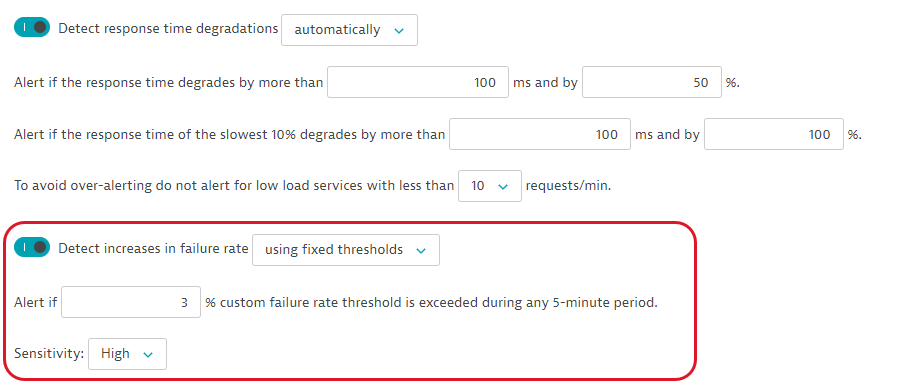
In this example, the request updates the configuration of anomaly detection for services from the GET request example. It changes the Detect increase in failure rate mode to used fixed thresholds and sets the following threshold with high sensitivity:
- Alert if 3% of custom failure rate threshold is exceeded during any 5-minute period.
The API token is passed in the Authorization header.
You can download or copy the example request body to try it out on your own. Be sure to create a backup copy of your current configuration with the GET services anomaly detection configuration call.
Curl
curl -X PUT \
  https://mySampleEnv.live.dexp.ae/api/config/v1/anomalyDetection/services \
  -H 'Authorization: Api-token abcdefjhij1234567890' \
  -H 'Content-Type: application/json' \
  -d '{
  "responseTimeDegradation": {
    "detectionMode": "DETECT_AUTOMATICALLY",
    "automaticDetection": {
      "responseTimeDegradationMilliseconds": 100,
      "responseTimeDegradationPercent": 50,
      "slowestResponseTimeDegradationMilliseconds": 100,
      "slowestResponseTimeDegradationPercent": 100,
      "loadThreshold": "TEN_REQUESTS_PER_MINUTE"
    }
  },
  "failureRateIncrease": {
    "detectionMode": "DETECT_USING_FIXED_THRESHOLDS",
    "thresholds": {
      "threshold": 3,
      "sensitivity": "HIGH"
    }
  }
}
'
Request URL
PUT https://mySampleEnv.live.dexp.ae/api/config/v1/anomalyDetection/services
Request body
api-examples/config/anomaly-detection/services/put-config.json
{
  "responseTimeDegradation": {
    "detectionMode": "DETECT_AUTOMATICALLY",
    "automaticDetection": {
      "responseTimeDegradationMilliseconds": 100,
      "responseTimeDegradationPercent": 50,
      "slowestResponseTimeDegradationMilliseconds": 100,
      "slowestResponseTimeDegradationPercent": 100,
      "loadThreshold": "TEN_REQUESTS_PER_MINUTE"
    }
  },
  "failureRateIncrease": {
    "detectionMode": "DETECT_USING_FIXED_THRESHOLDS",
    "thresholds": {
      "threshold": 3,
      "sensitivity": "HIGH"
    }
  }
}
Response code
204
Result
The updated configuration has the following parameters: