Key performance metrics
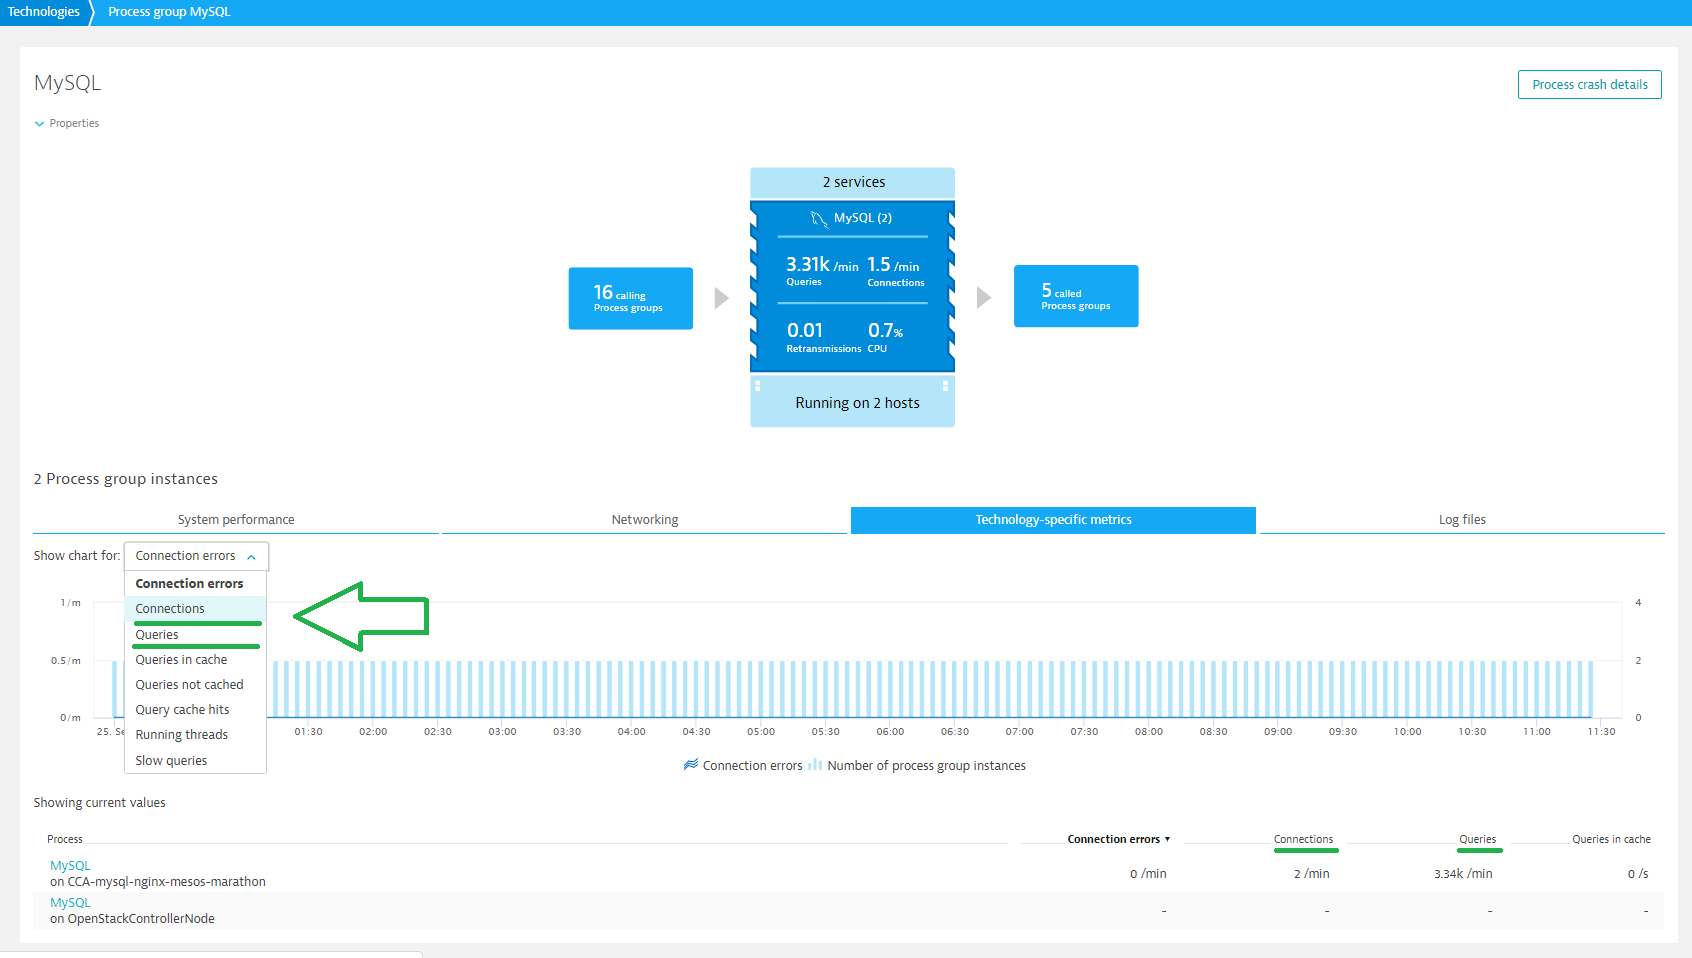
With keymetrics you choose the two most important metrics for your ActiveGate plugin-based monitoring needs that are to be displayed on the Process and Custom Device pages.
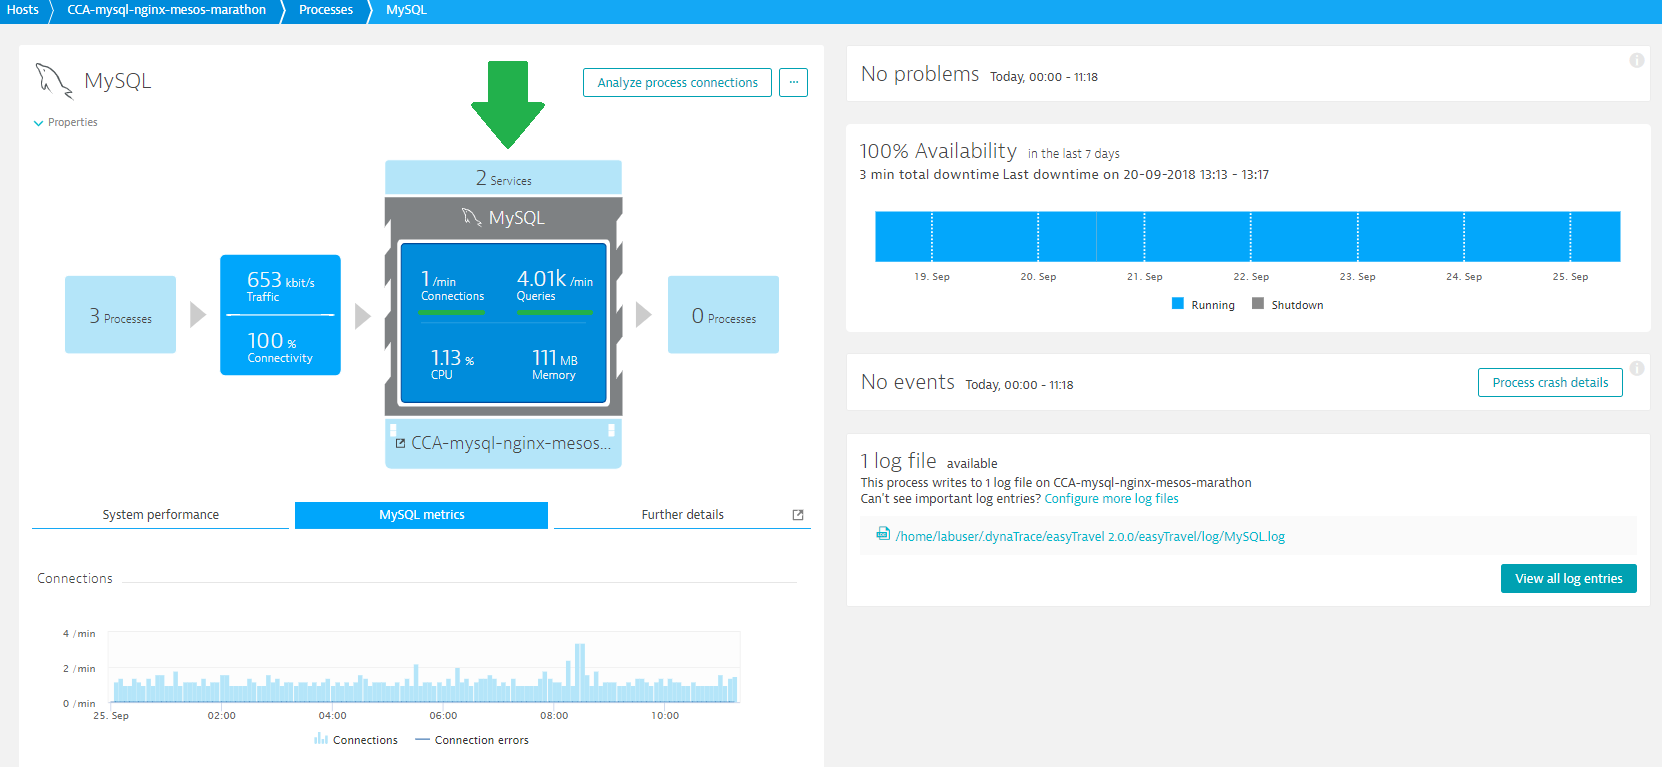
This enables you to compare the key metric values among your processes or custom devices.
You can also add a custom chart dashboard tile or create custom alerts based on the key metric values.
How to define key metrics in JSON
Identify the metric with the key property. Define the display name. The order is important, because the order in which you define the key metrics in JSON is reflected on the Process and Custom Device pages.
When defining key metrics, you should also decide on the two aspects of aggregation.
Time frame aggregation
In real time, the key metrics represent the present values. When you select a past time frame, you must define the aggregation method using the aggregation attribute.
Dimension aggregation
If your metric value is segmented by multiple dimensions, you need to define the method to merge the dimensions into a single one. You use mergeaggregation to do that.
Key metrics example
"keyMetrics": [
      {
        "key": "threads_connected",
        "aggregation": "avg",
        "mergeaggregation": "sum",
        "displayname": "Connections"
      },
      {
        "key": "queries",
        "aggregation": "avg",
        "mergeaggregation": "sum",
        "displayname": "Queries"
      }
See JSON reference.