Metric events anomaly detection API - GET an event
Gets parameters of the specified metric event rule.
The request produces an application/json payload.
This request is an early adopter release and may be changed in non compatible way.
| GET |
|
Parameters
| Parameter | Type | Description | In | Required |
|---|---|---|---|---|
| id | string |
The ID of the required metric event. |
path | required |
Response format
The MetricEvent object
The configuration of the metric event.
| Element | Type | Description |
|---|---|---|
| metadata | ConfigurationMetadata | Metadata useful for debugging. |
| id | string | The ID of the metric event. |
| metricId | string | The ID of the metric evaluated by the metric event. |
| name | string | The name of the metric event displayed in the UI. |
| description | string | The description of the metric event. |
| aggregationType | string | How the metric data points are aggregated for the evaluation. The timeseries must support this aggregation. |
| severity | string | The type of the event to trigger on the threshold violation. The |
| alertCondition | string | The condition for the threshold value check: above or below. |
| samples | integer | The number of one-minute samples that form sliding evaluation window. |
| violatingSamples | integer | The number of one-minute samples within the evaluation window that must violate the threshold to trigger an event |
| dealertingSamples | integer | The number of one-minute samples within the evaluation window that must go back to normal to close the event. |
| threshold | number | The value of the threshold. |
| enabled | boolean | The metric event is enabled ( |
| alertingScope | MetricEventAlertingScope[] | Defines the scope of the metric event. |
| metricDimensions | MetricEventDimensions[] | Defines the dimensions of the metric to alert on. |
| unit | string | The unit of the threshold, matching the metric definition. If not set the metrics unit is picked. |
The MetricEventDimensions object
A single filter for the metrics dimensions.
This is the base version of the filter, depending on the type, the actual JSON may contain additional fields.
| Element | Type | Description |
|---|---|---|
| filterType | string | Defines the actual set of fields depending on the value: ENTITY -> MetricEventEntityDimensions STRING -> MetricEventStringDimensions |
| name | string | The dimensions name. Sending this has no effect while creating a configuration, as only the index of the dimension is used here -> dimension names might change, indexes not. |
| index | integer | The dimensions index on the metric. |
The MetricEventAlertingScope object
A single filter for the alerting scope.
This is the base version of the filter, depending on the type, the actual JSON may contain additional fields.
| Element | Type | Description |
|---|---|---|
| filterType | string | Defines the actual set of fields depending on the value: ENTITY_ID -> EntityIdAlertingScope MANAGEMENT_ZONE -> ManagementZoneAlertingScope TAG -> TagFilterAlertingScope NAME -> NameAlertingScope CUSTOM_DEVICE_GROUP_NAME -> CustomDeviceGroupNameAlertingScope HOST_GROUP_NAME -> HostGroupNameAlertingScope HOST_NAME -> HostNameAlertingScope PROCESS_GROUP_ID -> ProcessGroupIdAlertingScope PROCESS_GROUP_NAME -> ProcessGroupNameAlertingScope |
The ConfigurationMetadata object
Metadata useful for debugging
| Element | Type | Description |
|---|---|---|
| configurationVersions | integer[] | A Sorted list of the version numbers of the configuration. |
| clusterVersion | string | DESK server version. |
{
  "metadata": {
    "configurationVersions": [
      4,
      2
    ],
    "clusterVersion": {
      "major": 0,
      "minor": 0,
      "revision": 0,
      "sourceRevision": "",
      "timestamp": ""
    }
  },
  "metricId": "com.DESK.builtin:host.disk.bytesread",
  "name": "My metric event",
  "description": "This is the description for my metric event.\n",
  "aggregationType": "AVG",
  "severity": "CUSTOM_ALERT",
  "alertCondition": "ABOVE",
  "samples": 5,
  "violatingSamples": 3,
  "dealertingSamples": 5,
  "threshold": 80,
  "alertingScope": [
    {
      "filterType": "ENTITY_ID",
      "entityId": "HOST-000000000001E240"
    },
    {
      "filterType": "TAG",
      "tagFilter": {
        "context": "CONTEXTLESS",
        "key": "someKey",
        "value": "someValue"
      }
    }
  ],
  "metricDimensions": [
    {
      "filterType": "ENTITY",
      "name": "disk",
      "index": 1,
      "nameFilter": {
        "value": "diskName",
        "operator": "EQUALS"
      }
    }
  ],
  "enabled": true,
  "unit": "KILO_BYTE_PER_SECOND"
}
Example
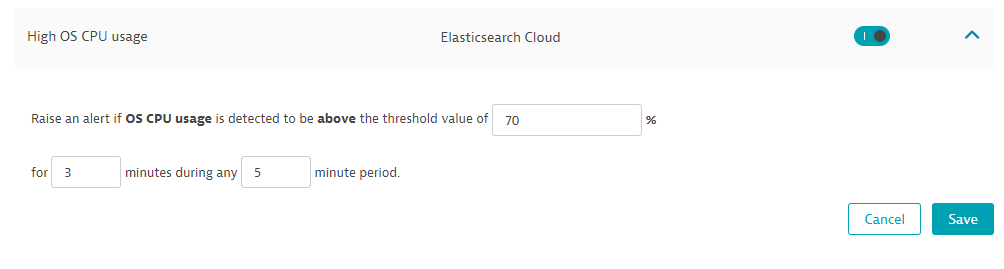
In this example, the request lists the parameters of the High OS CPU usage custom metric event rule.
The API token is passed in the Authorization header.
The rule has the following parameters:
Curl
curl -X GET \
  https://mySampleEnv.live.dexp.ae/api/config/v1/anomalyDetection/metricEvents/DESK.remote.python.elasticsearch:node.os.cpu_percent:node.os.cpu_percent.high_usage \
  -H 'Authorization: api-token abcdefjhij1234567890'
Request URL
https://mySampleEnv.live.dexp.ae/api/config/v1/anomalyDetection/metricEvents/DESK.remote.python.elasticsearch:node.os.cpu_percent:node.os.cpu_percent.high_usage
Response body
{
  "metadata": {
    "clusterVersion": "1.164.0.20190211-085949",
    "configurationVersions": [
      2
    ]
  },
  "id": "DESK.remote.python.elasticsearch:node.os.cpu_percent:node.os.cpu_percent.high_usage",
  "metricId": "DESK.remote.python.elasticsearch:node.os.cpu_percent",
  "name": "High OS CPU usage",
  "description": "The OS CPU usage is {alert_condition} the threshold of {threshold}",
  "aggregationType": "AVG",
  "eventType": "PERFORMANCE",
  "alertCondition": "ABOVE",
  "samples": 5,
  "violatingSamples": 3,
  "dealertingSamples": 5,
  "threshold": 70,
  "enabled": true,
  "tagFilters": []
}
Response code
200