ActiveGate plugin capabilities
The ActiveGate plugins framework enables you to extend DESK monitoring to remote technologies and fully integrate them into your DESK monitoring landscape.
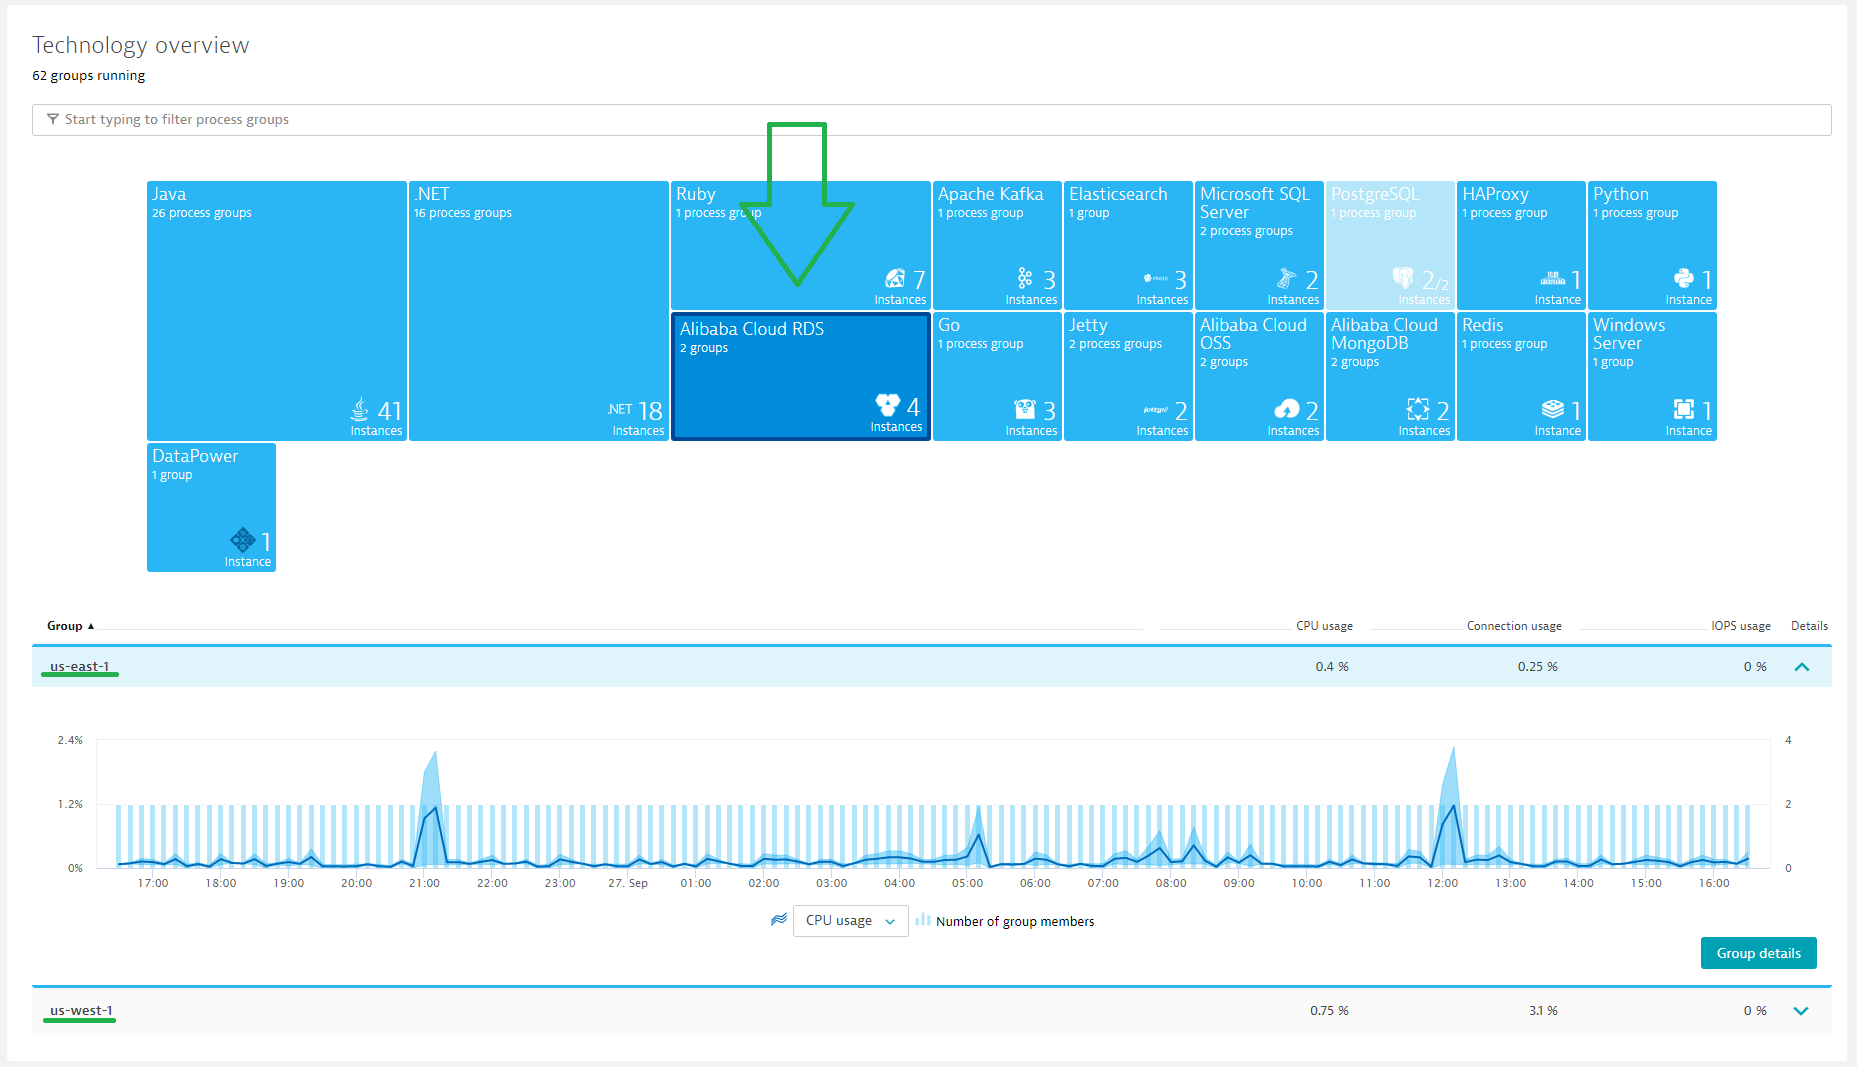
Define new technologies
Plugin-monitoring results are presented next to out-of-the-box OneAgent-monitored technologies on the Technology overview page. Each technology tile that derives its data from an ActiveGate plugin represents a "device group." Related device groups are displayed on a single tile. With the key metrics feature, you can define the most important metrics that should be presented here. With the JSON favicon property, you can define your own custom icon. Use the Technology overview page to compare the performance of plugin-monitored device groups and drill down directly to any device that's related to a detected problems.
Understand the health of plugin-monitored device groups
The performance of a single device isn't as critical as the overall performance of the device group. Device groups can auto-heal, rebalance traffic, auto-scale and more. ActiveGate plugins are cloud native. They can automatically discover and monitor new devices and device groups.
Device groups can represent clusters, regions, group of servers, etc. For example, you might define a device group to represent an Alibaba Cloud region. It's up to you to define groups that serve your individual monitoring needs. For more information, see Report device group metrics.
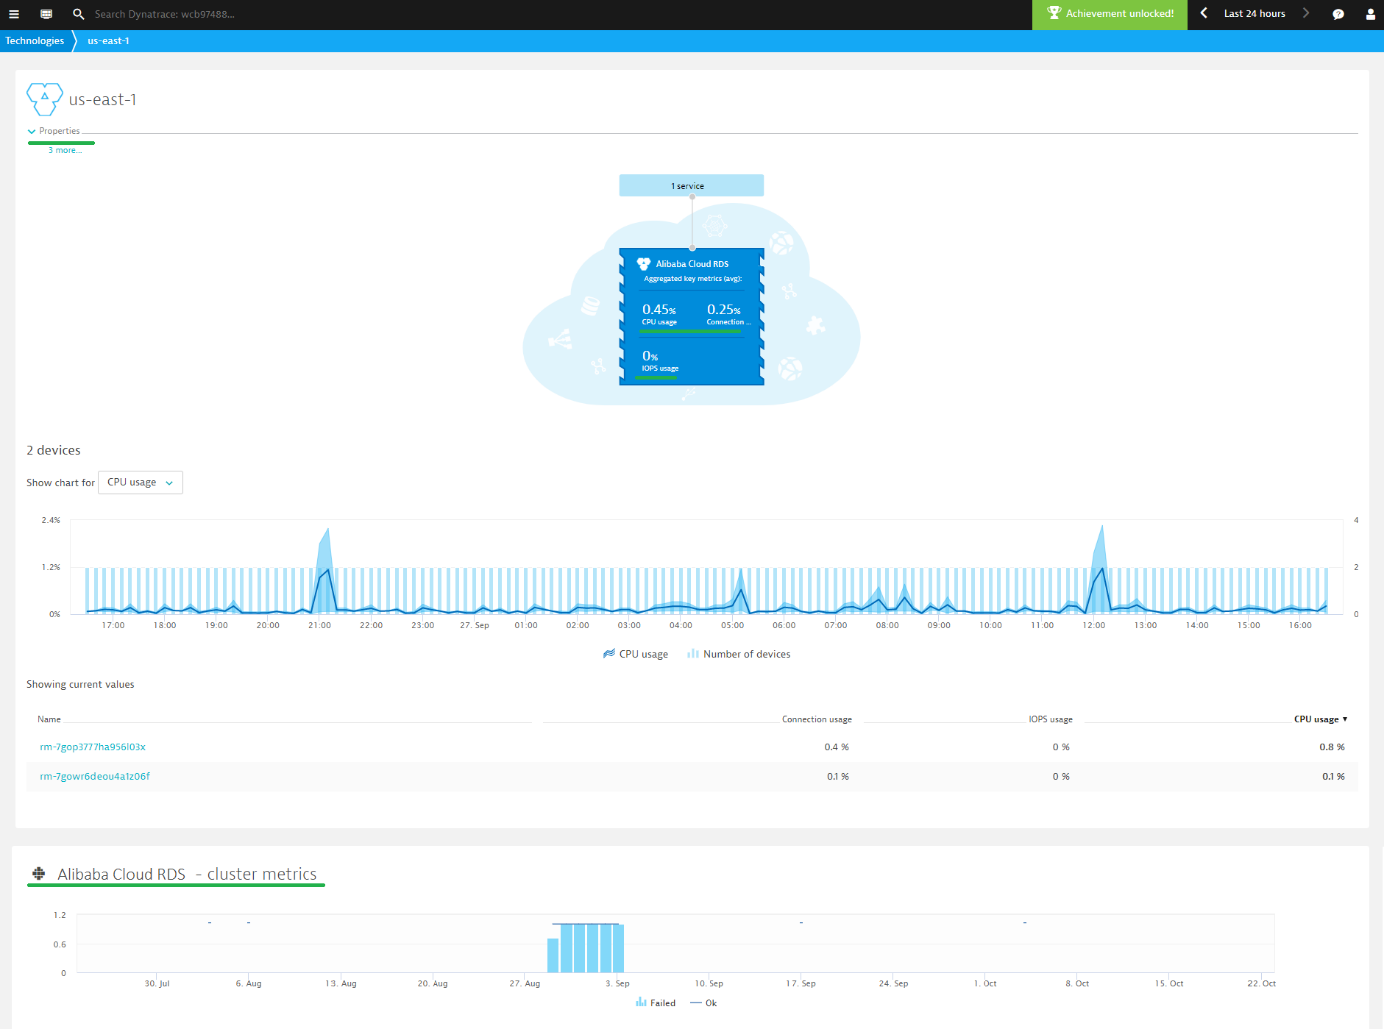
To monitor your device group metrics, bind metrics and properties to your Custom Device Group entity. The key custom device group metrics will be presented in the infographic. Device group metrics are presented in the device group charts section. With JSON, you can define the type and look of your charts.
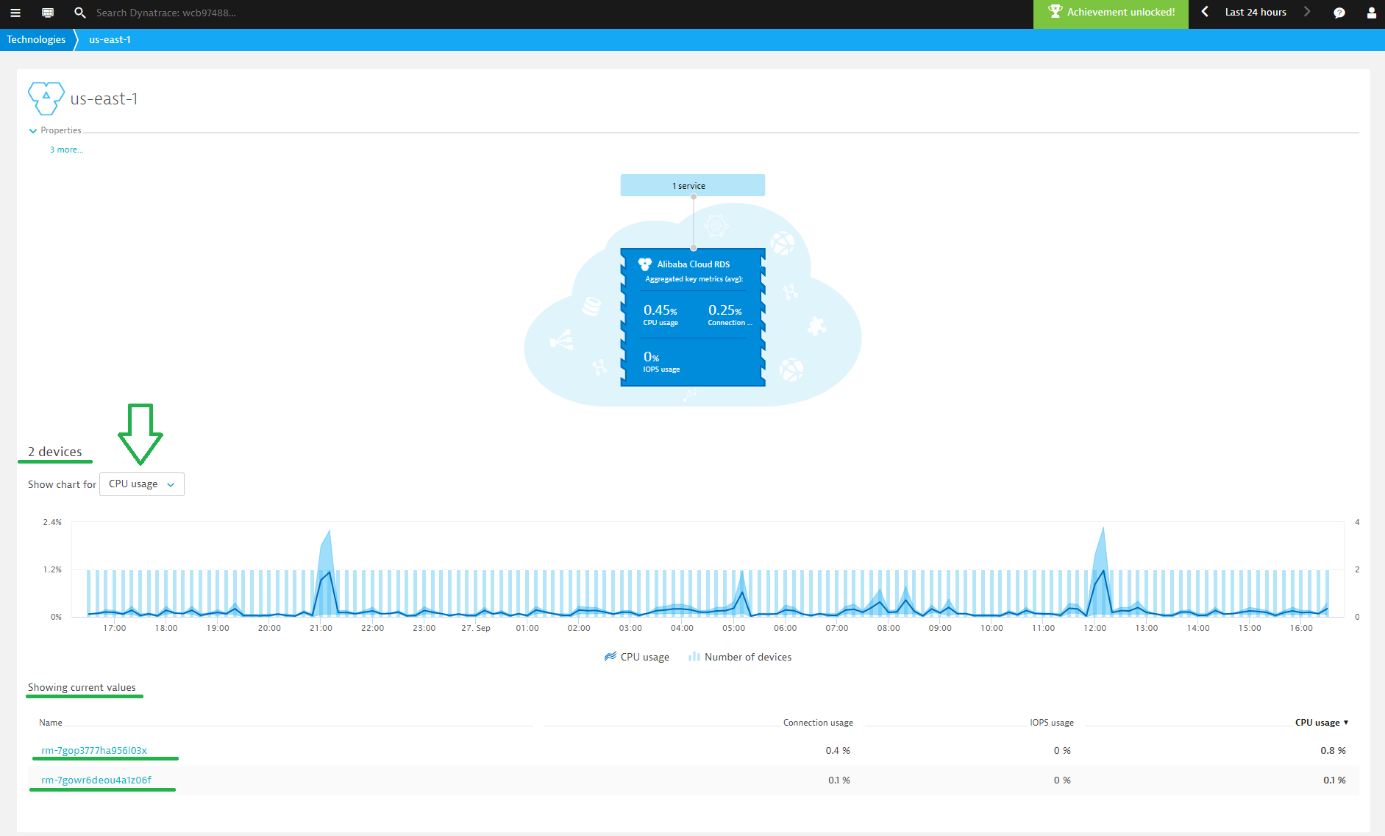
Identify an underperforming group element
Use the Group overview page to compare the device group elements and identify those causing problems. You can find all your group members in a table and analyze the trends. The dropdown enables you to select the metrics to analyze. Define the custom device metrics using JSON via the pgmetrics section. By default, the table shows current metric values. Click through the chart or change the timeframe to see the aggregated data.
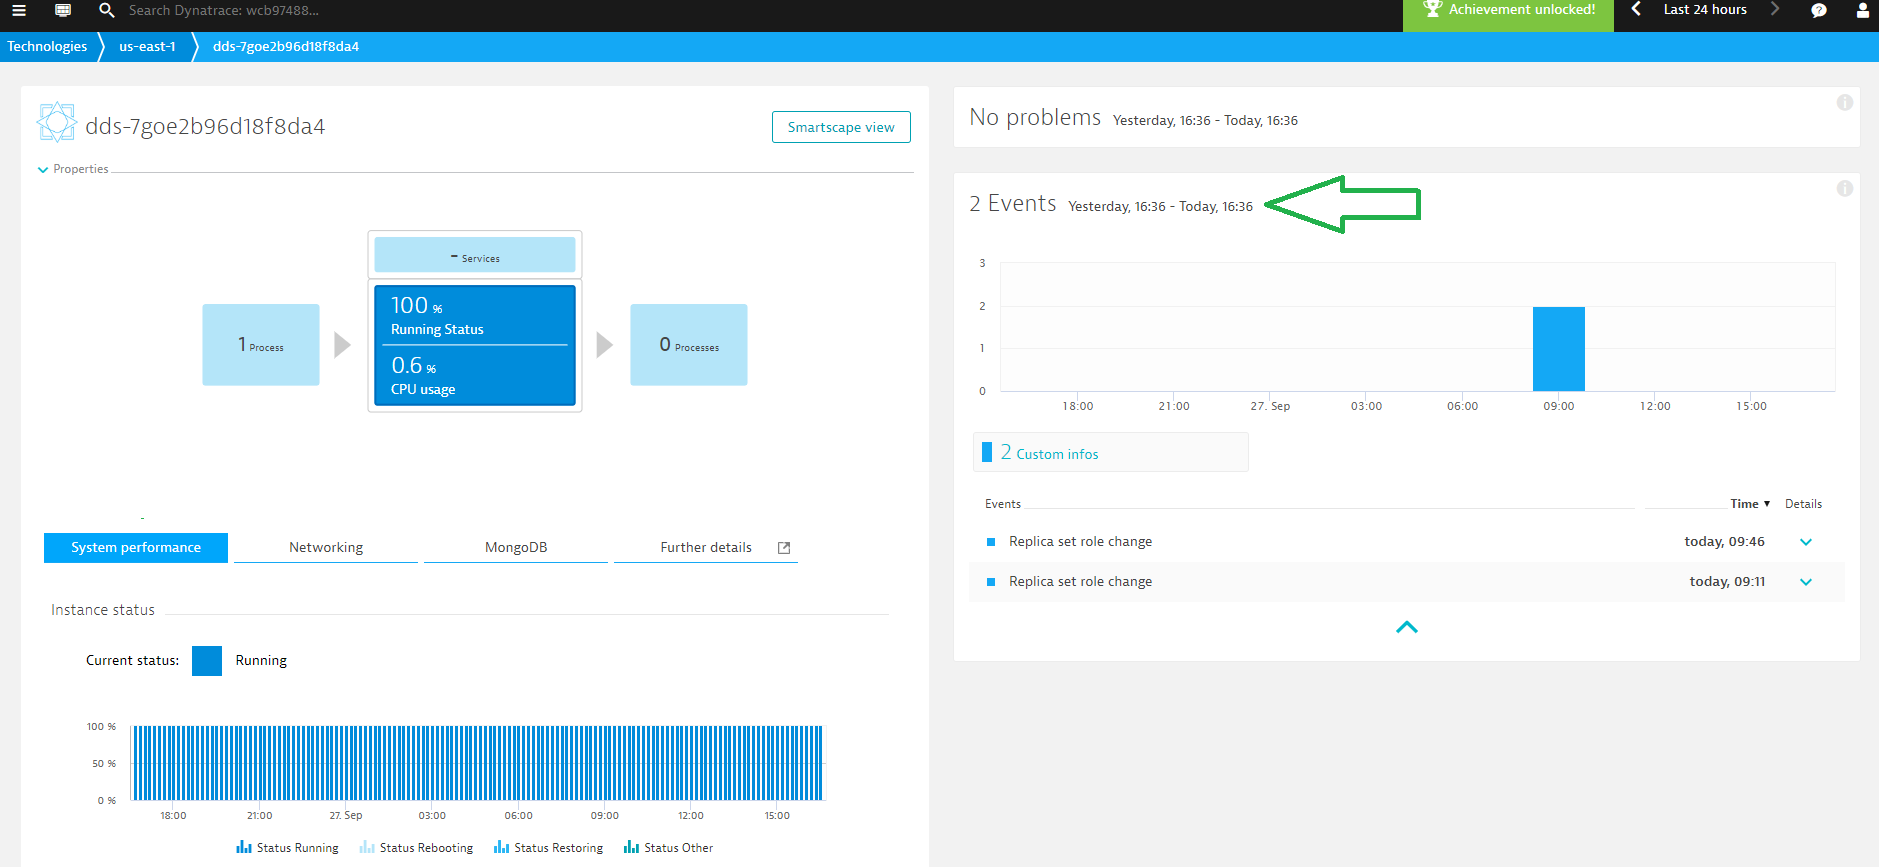
Analyze your group element health
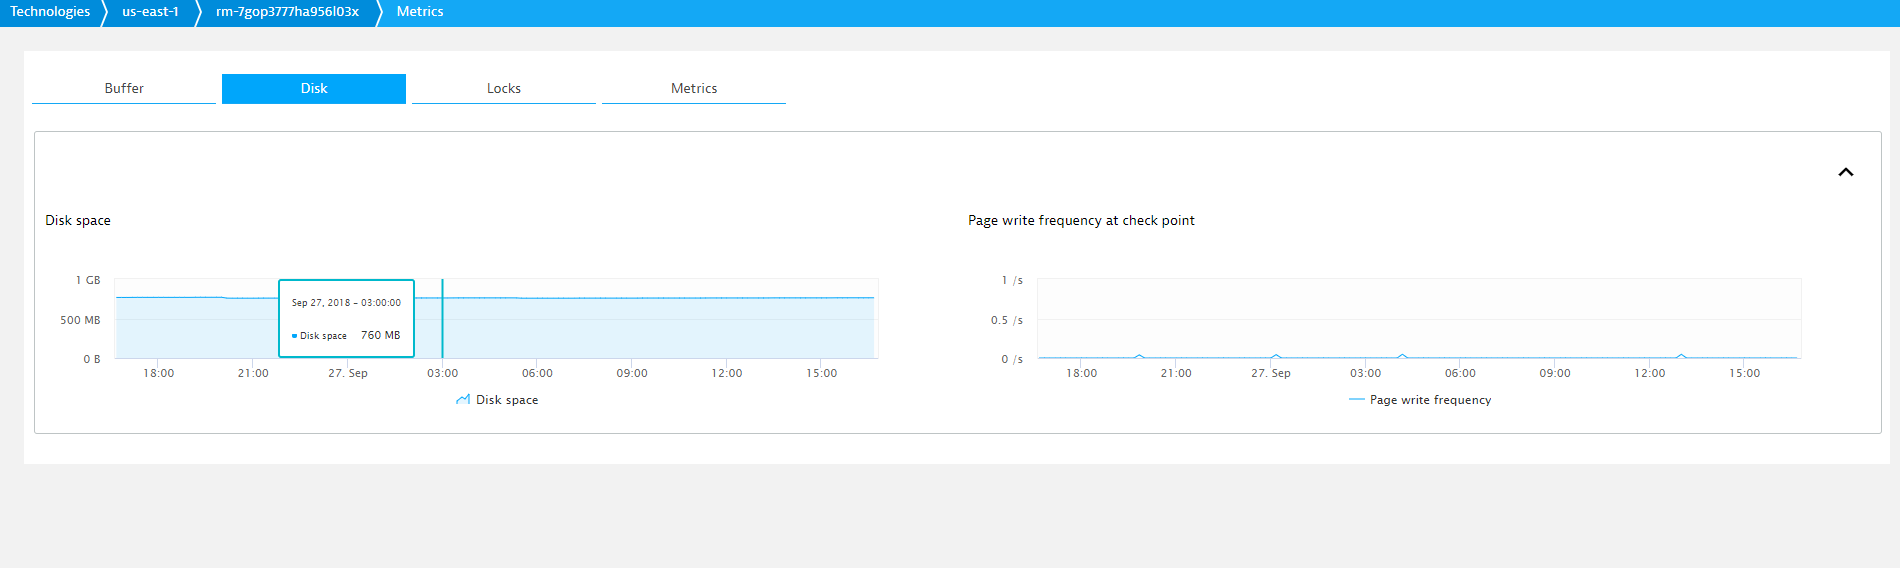
Analyze your technology health, events, and metrics using the Custom device page. ActiveGate plugins offer a variety of helpful features. You can define custom tabs and add there the charts of your choice. You can add properties, so that you can fetch them via API and use for other purposes like CMBD. What's more, you can define events which will feed the DESK AI or generate a DESK problem.
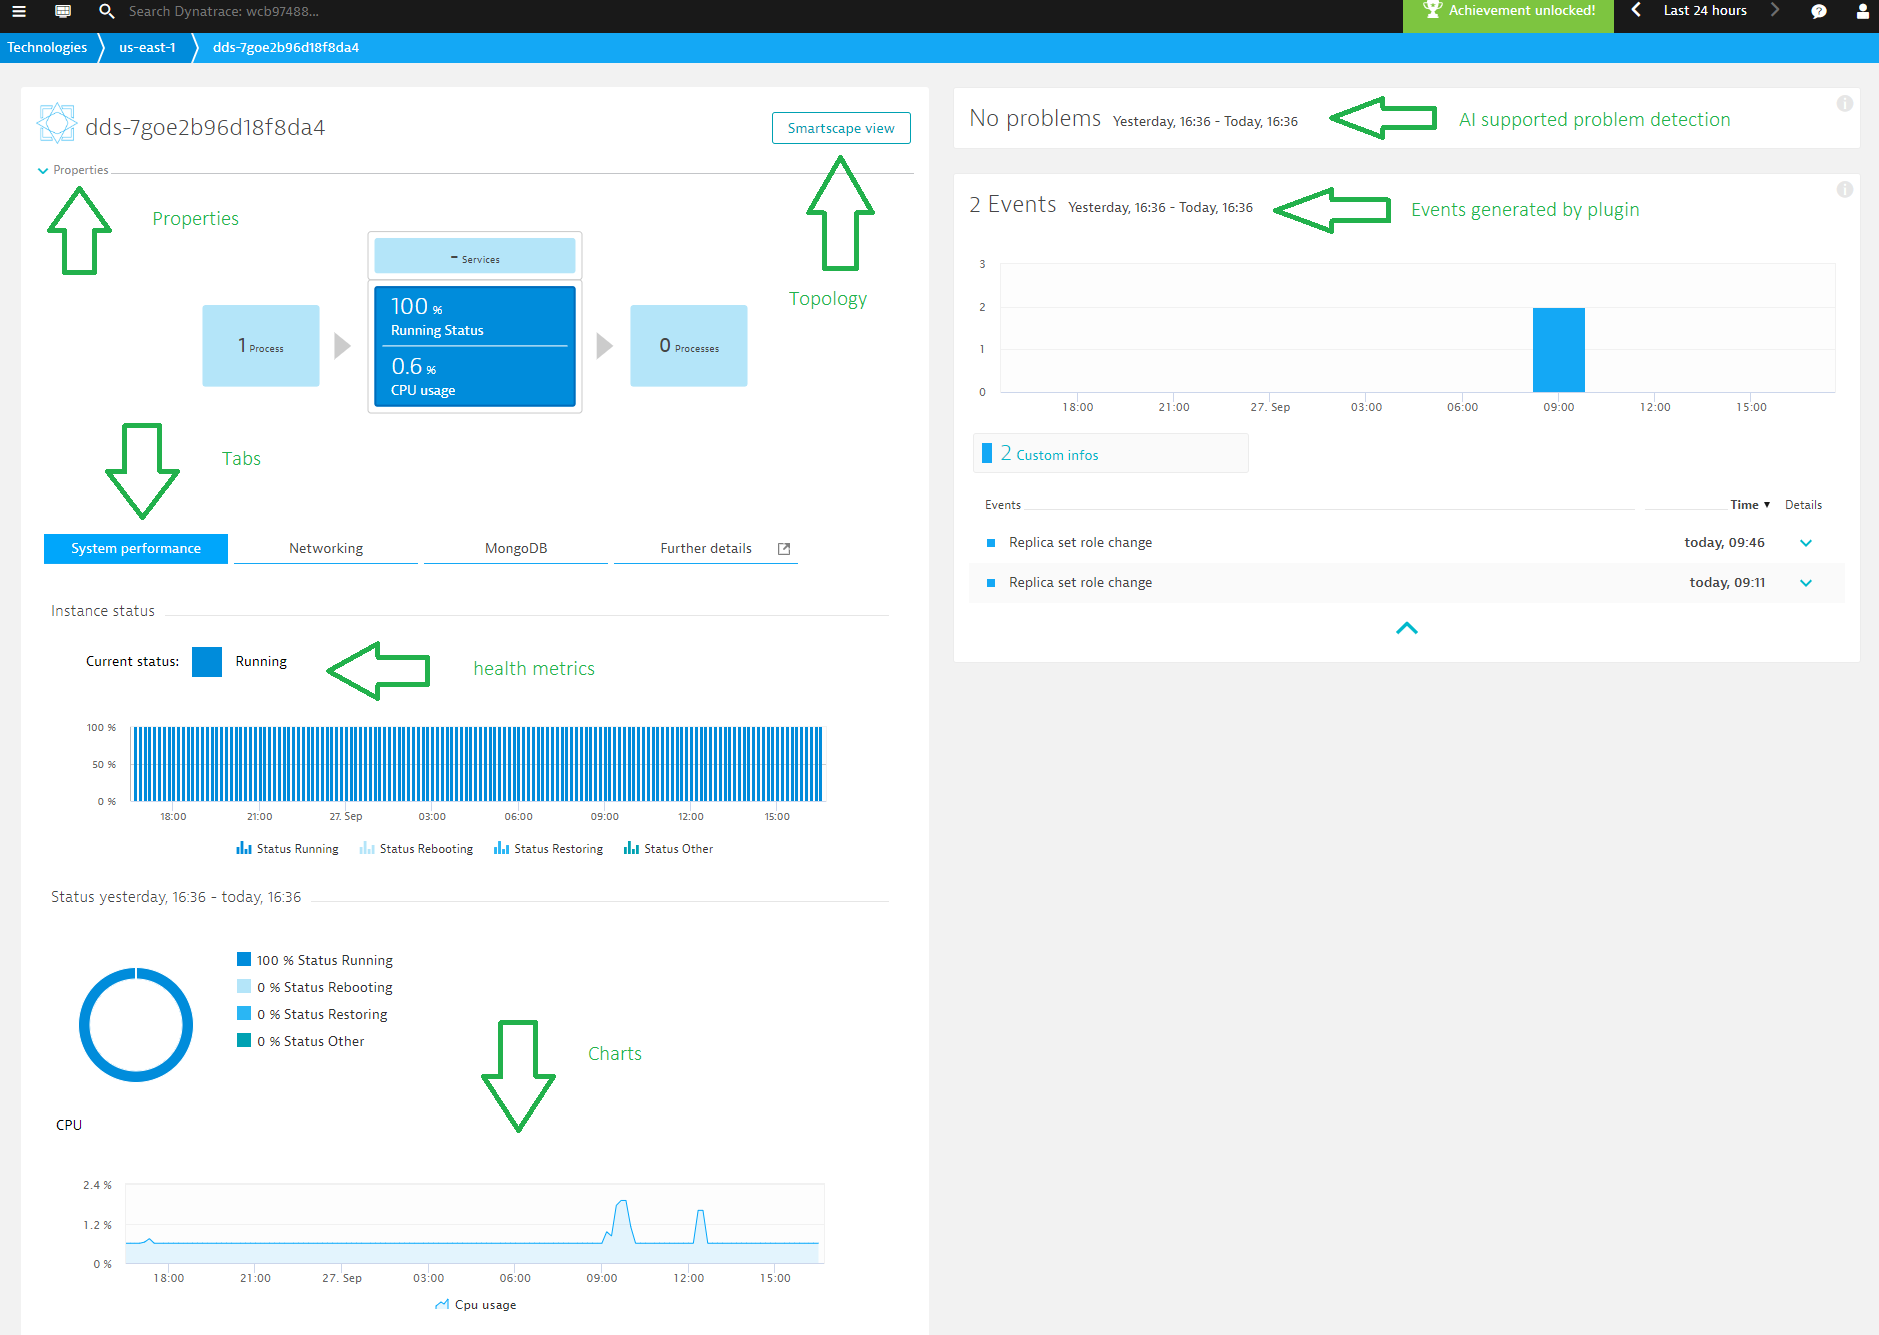
Select the Further details tab to see metrics segmented by dimensions.
With DESK version 1.158+, the DESK AI can detect the metrics change point, which makes it possible to identify the root cause of a problem, without triggering events or setting manual thresholds. All you need to do is feed DESK with topology and metrics. The DESK AI takes care of the rest.
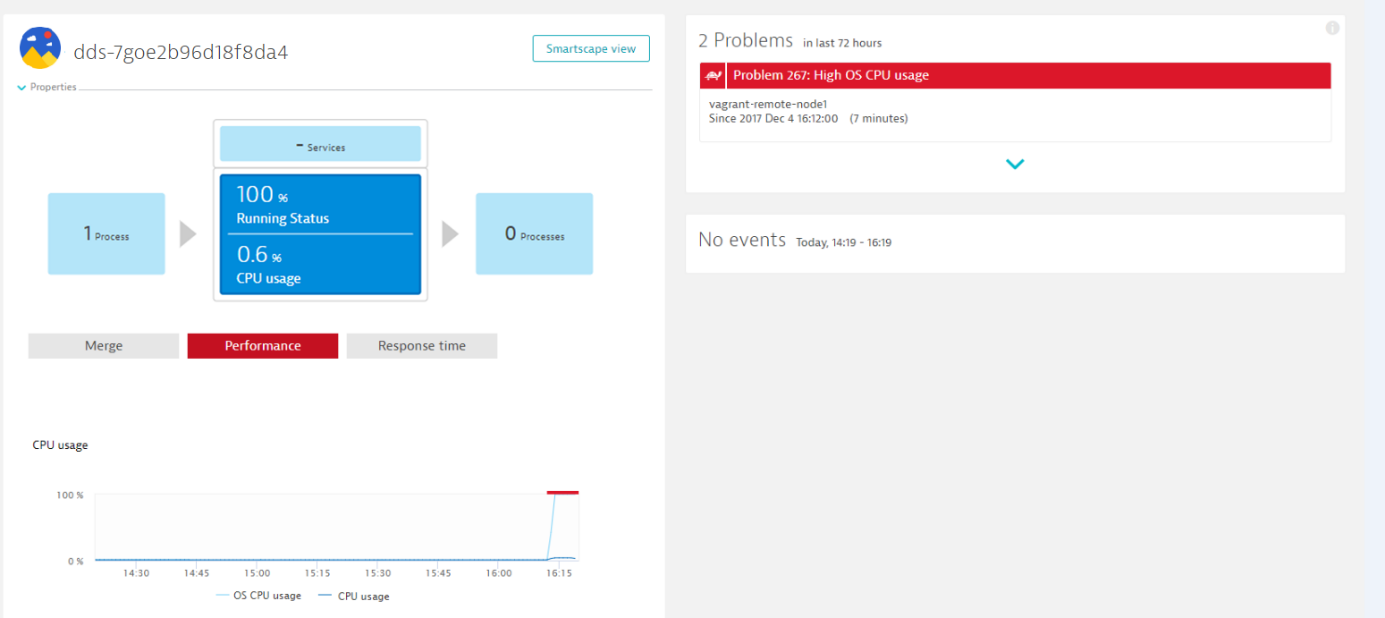
Resolve problems before your users are impacted
DESK automatically learns your application’s baseline performance and detects response-time degradation and error rate increases within your application environment. Additional infrastructure performance problems help you in resolving issues before customers are impacted. Once created, DESK uses AI to determine the root of the problem, analyzing all layers of your application's terabytes of data.
You can either create problems based on a metric threshold violation using a simple JSON definition or you can use the PYTHON API to raise performance, availability, error, and resource contention type of problems. Some technologies expose information about their own events. In such a case, you can map events to appropriate DESK problems or events. DESK treats ActiveGate plugin-raised problems in exactly the same way as internally generated problems. To learn more about DESK problems and events, see Problems.
Enhance DESK root cause analysis
With ActiveGate plugins you can send events. Events don’t raise problems. They enhance DESK root cause analysis. DESK AI determines whether an event can be responsible for a problem. You can feed DESK with an info, deployment or annotation event. You can forward a technology exposed event to DESK. For more information, see Problems and events.
With DESK version 1.158+, the DESK AI is capable of finding root causes in metrics that are provided by plugins, even without an event. The DESK AI can also detect metric change points and correlate them to problems.