DESK -
APM is a platform designed
to help digital teams automate key
business processes.
How can AI DESK help you?
Boost productivity growth |
Reduce opex
| Bring IT and business together
| Bring IT and business together
Choose your DESK
IT DESK
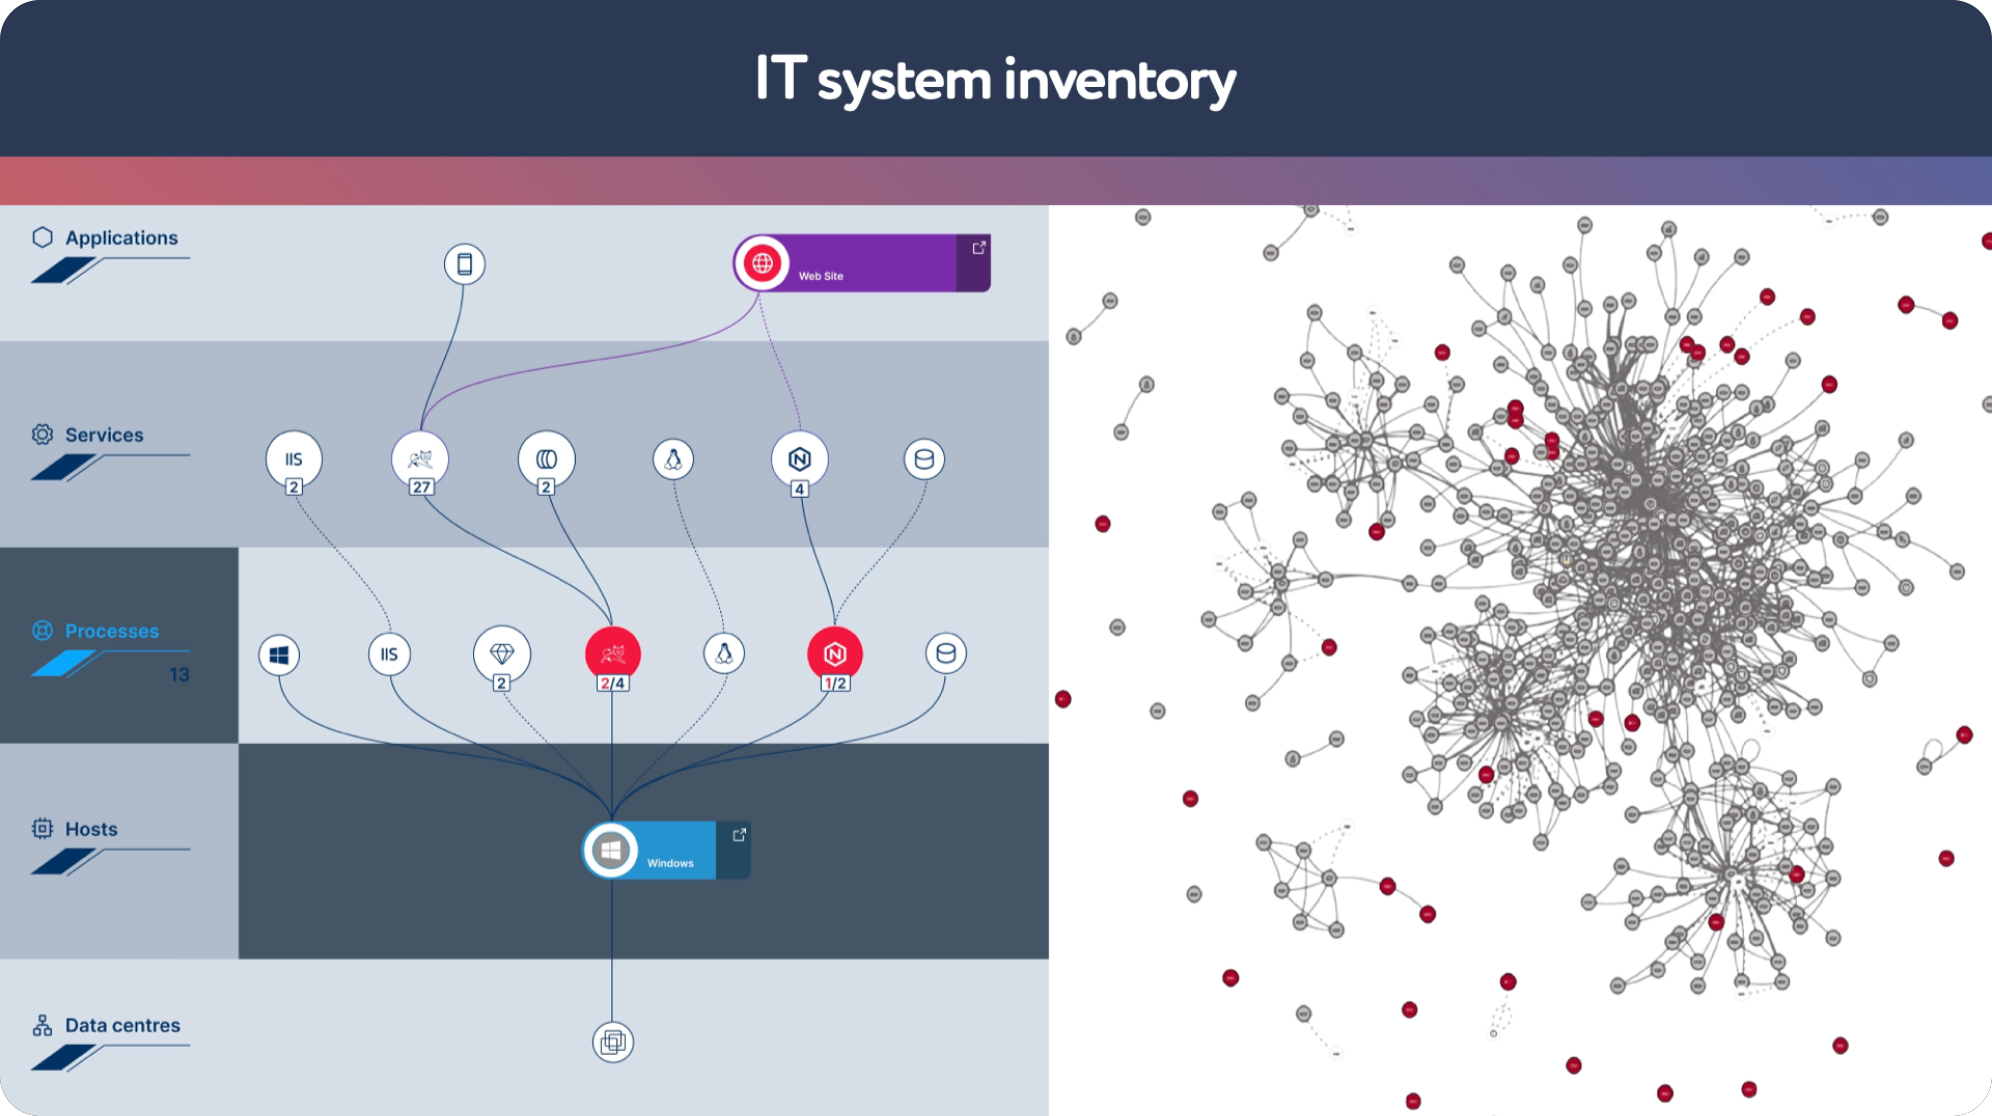
Automated analysis and displaying of your
system’s digital elements, their interrelationships,
and performance indicators
system’s digital elements, their interrelationships,
and performance indicators
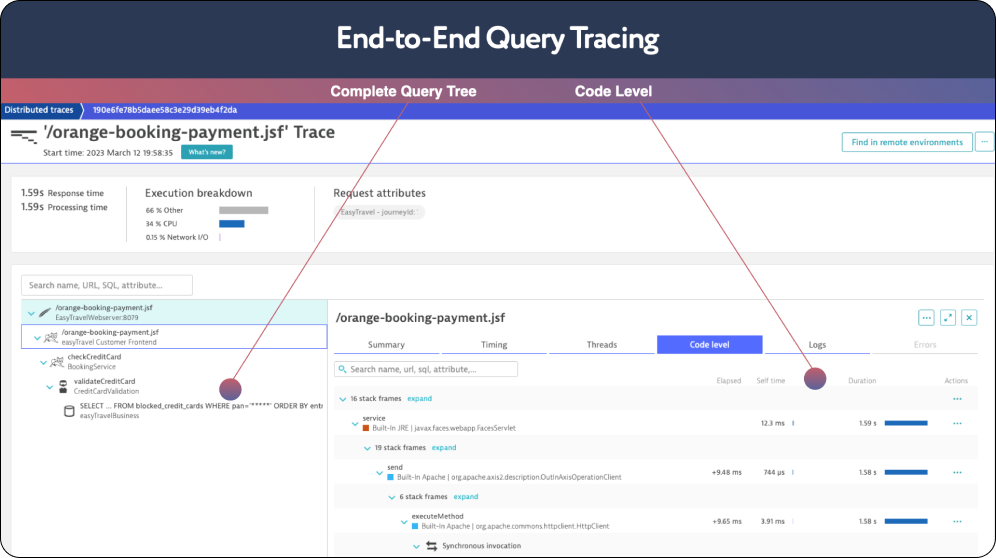
DESK will automatically display each query
as a logical sequence of calls with code-level drilldown
as a logical sequence of calls with code-level drilldown

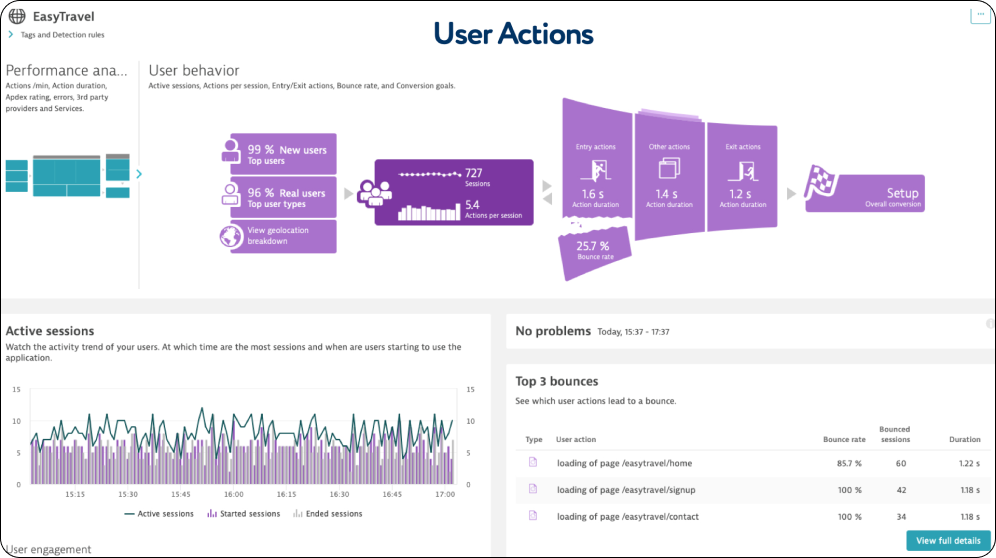
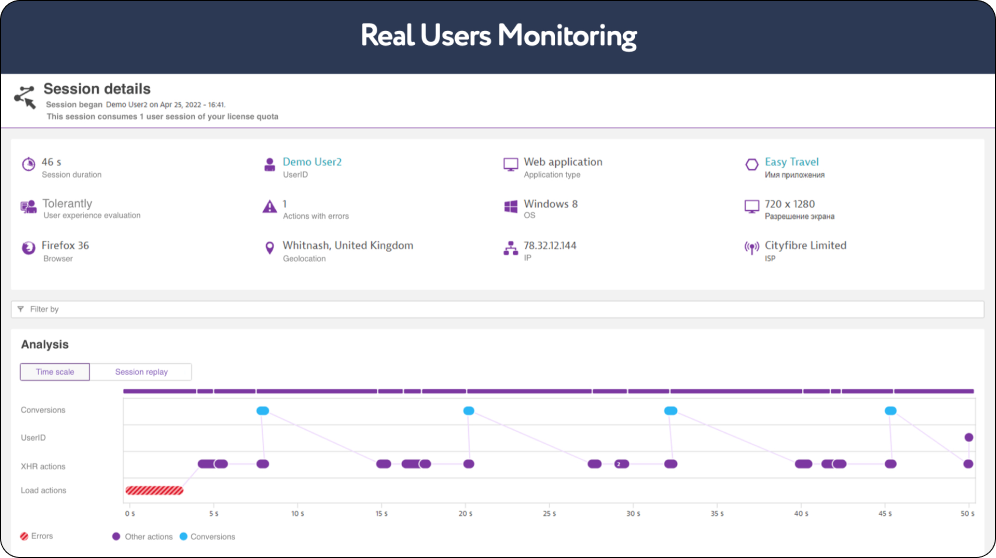
Real-time tracing of users’ actions + / device and query status: you can see the device status,
as well as the backend queries and errors, right in the process of transaction execution
as well as the backend queries and errors, right in the process of transaction execution
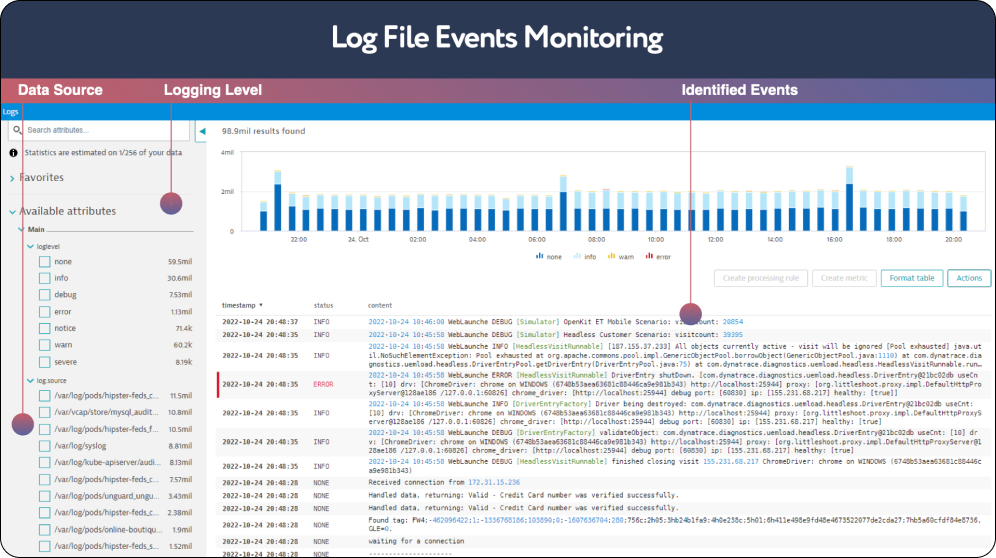
Log monitoring helps the teams respond to the incidents faster
and discover the issues before they affect the end-users.
and discover the issues before they affect the end-users.
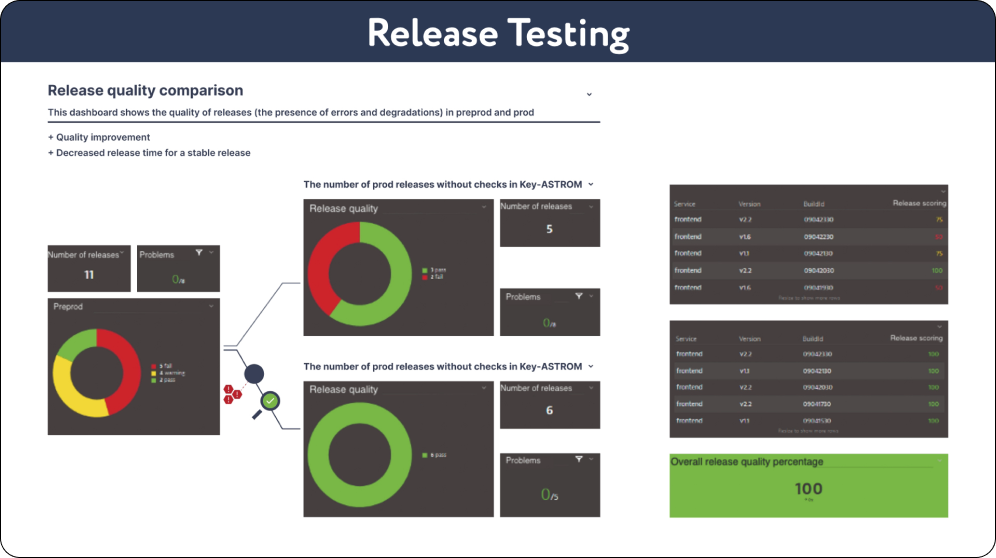
Stress testing of new software releases becomes way much faster. You can see your system from inside - drilling
down to the minor detail, you will be able to expedite debugging and significantly improve your time-to-market.
down to the minor detail, you will be able to expedite debugging and significantly improve your time-to-market.
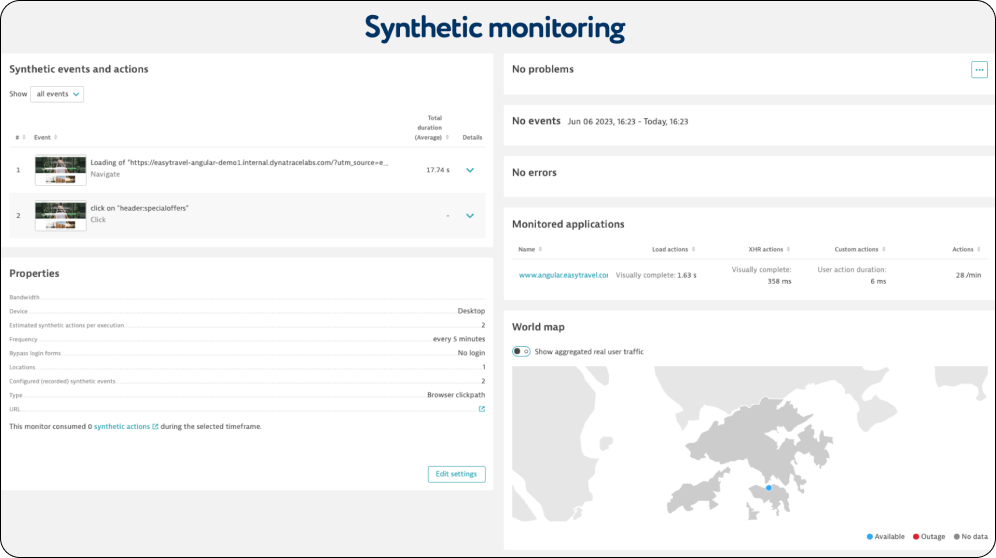
With synthetic monitoring, you will easily understand how well your application complies with the SLA.
Artificial Intelligence will help you to find the issues fast and rank them based on their priority and severity.
Artificial Intelligence will help you to find the issues fast and rank them based on their priority and severity.
Business DESK
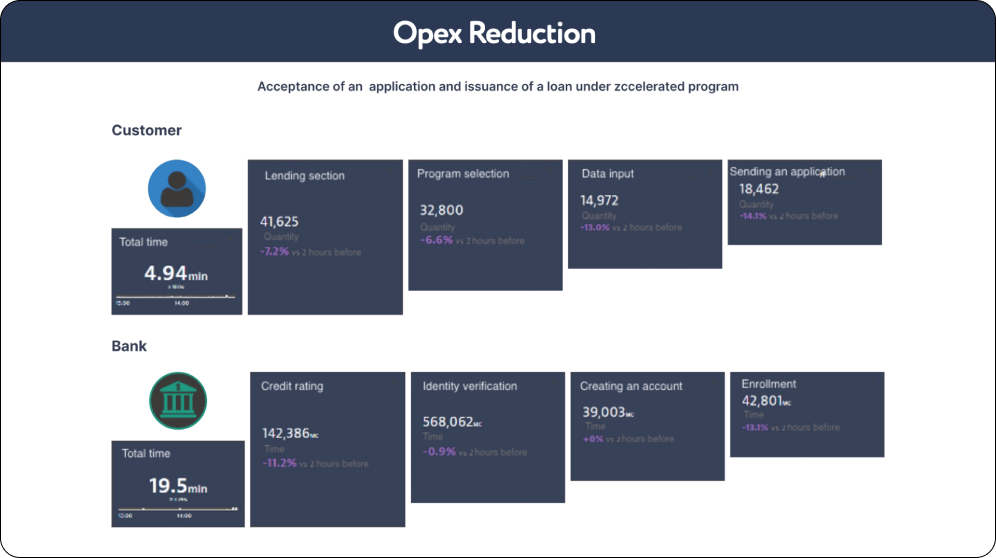
Monitoring of all business process steps. Measuring the duration of each transaction and the whole business process through SW code analysis.
Analysis of business process bottlenecks. Continuous SLA monitoring across all business process steps.
Analysis of business process bottlenecks. Continuous SLA monitoring across all business process steps.
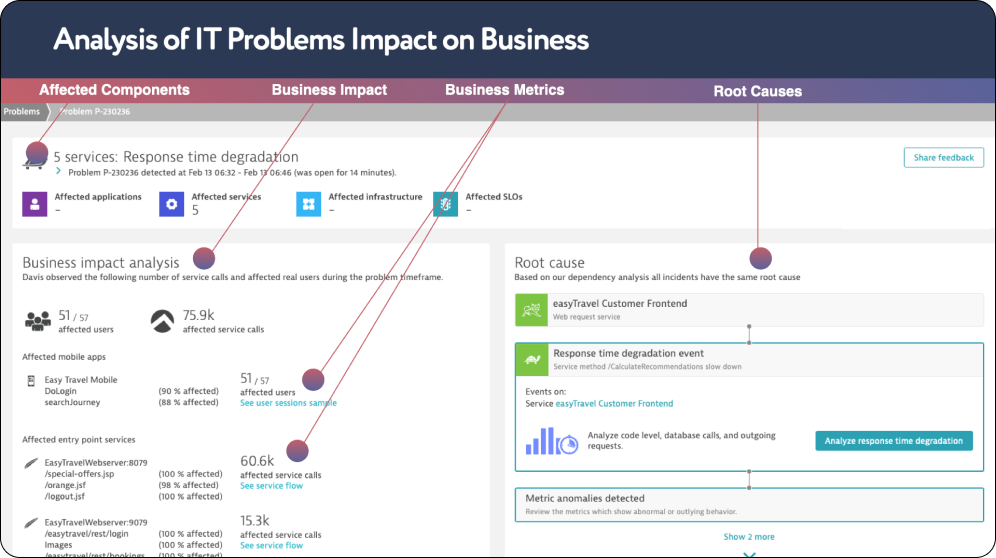
Business Impact of Problems
Improved Team Building. The relationship between your IT and business units will be based on metrics and indicators rather than finger pointing.
Improved Team Building. The relationship between your IT and business units will be based on metrics and indicators rather than finger pointing.
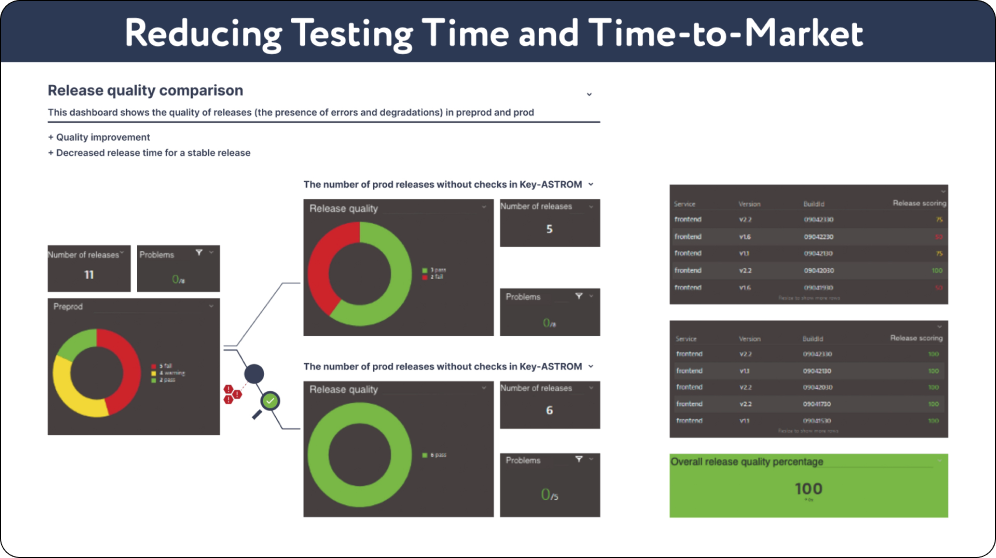
Testing Time and Time-to-Market
You will reduce your time-to-market and therefore minimize the costs related to testing new applications.
You will reduce your time-to-market and therefore minimize the costs related to testing new applications.
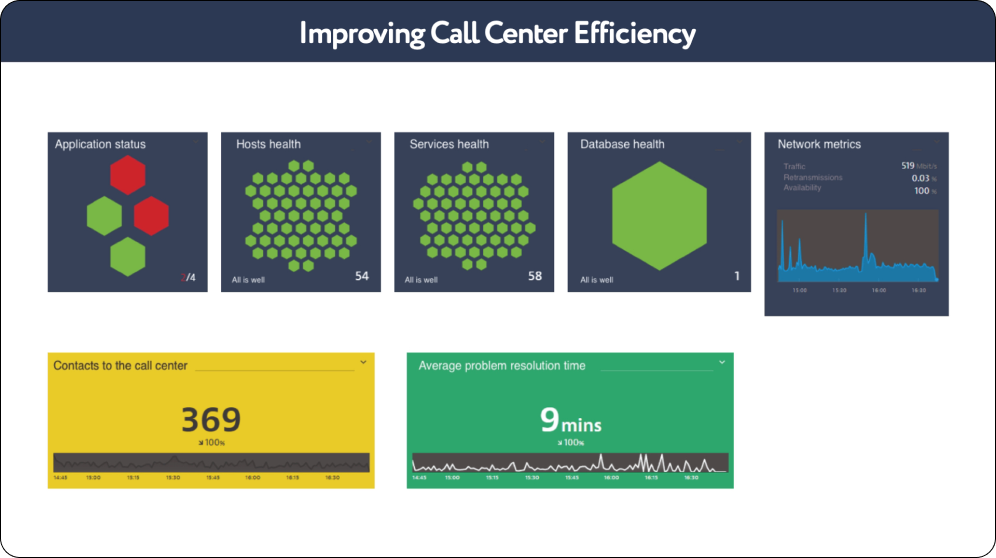
Center Efficiency
You will decrease the number of trouble tickets and your call center employees’ work hours per year.
You will decrease the number of trouble tickets and your call center employees’ work hours per year.
Marketing DESK
DESK is a comprehensive solution. Therefore, in addition to marketing analytics you will be getting for analysis technical data such as service
components load time. It will help you to identify interdependencies between your technical and marketing indicators.
components load time. It will help you to identify interdependencies between your technical and marketing indicators.
You will improve your users’ digital journey: you will know what your users do while logged onto the system, what their
interests are, and what kind of problems affect them.
interests are, and what kind of problems affect them.
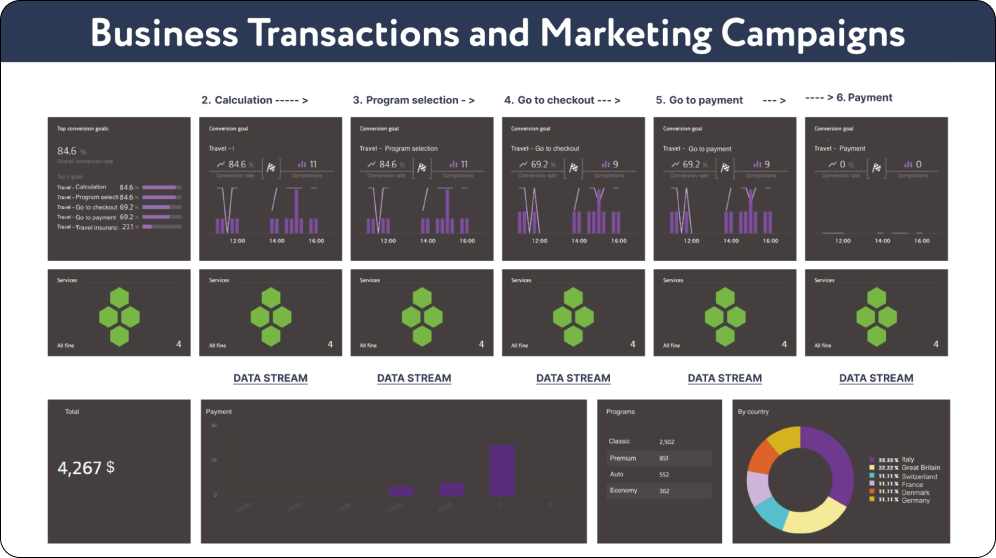
Transactions and Marketing Campaigns
Where business indicators are available, they can be captured and displayed on dashboards for analysis by analysts and product managers.
CR - Churn Rate. ARPU - Average Revenue per User. ARPPU - Average Revenue per Paying User. LTV - Lifetime Value.
Where business indicators are available, they can be captured and displayed on dashboards for analysis by analysts and product managers.
CR - Churn Rate. ARPU - Average Revenue per User. ARPPU - Average Revenue per Paying User. LTV - Lifetime Value.
Security DESK
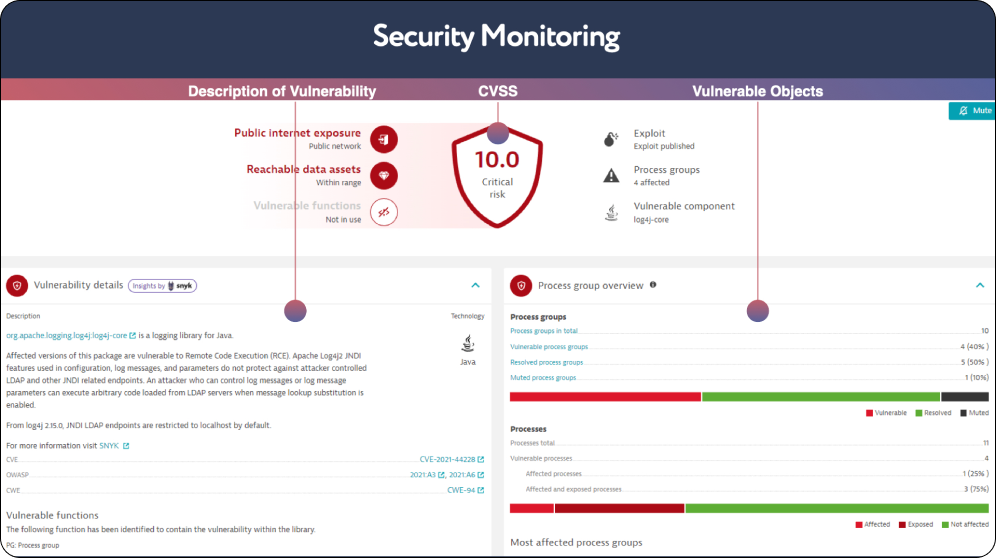
Stay informed of all code-level information security events. Each event is ranked according to its priority and severity.
The vulnerability database is updated automatically in real time.
The vulnerability database is updated automatically in real time.
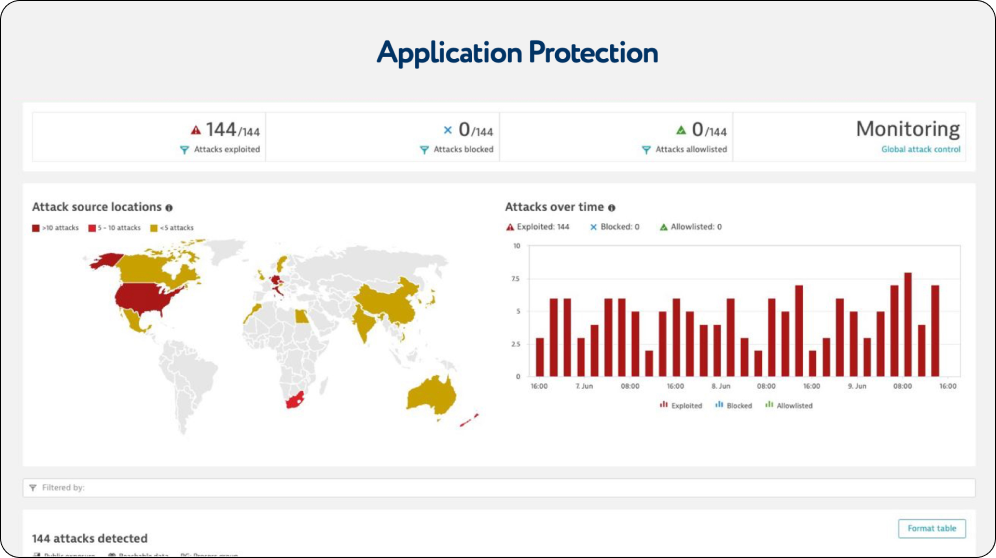
You can now analyze the security of each of your locations based on: IP address - the number of attackers’ unique IP addresses.
Geography - the number of unique geographic locations within the country of the attacker. Attacks - the total number of attacks from
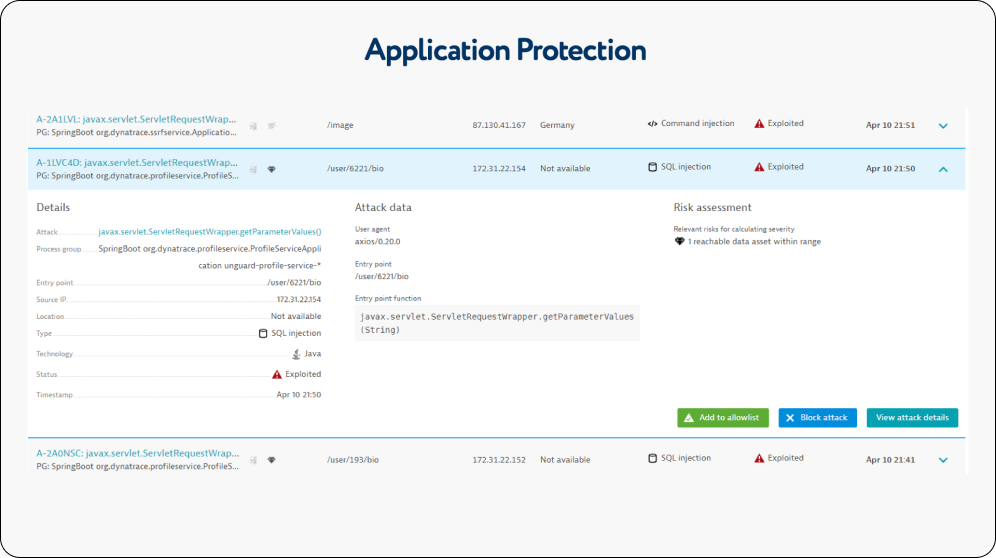
a given location. Quantity - the total number of attacks from a given country/region. Most recent attacks - a list of most recent registered
attacks displaying the type of intrusion, the IP address of the intruder, the time stamp, and the city
Geography - the number of unique geographic locations within the country of the attacker. Attacks - the total number of attacks from
a given location. Quantity - the total number of attacks from a given country/region. Most recent attacks - a list of most recent registered
attacks displaying the type of intrusion, the IP address of the intruder, the time stamp, and the city
In addition to the system security monitoring, you analyze the types of attacks on your system:
Exploited - i.e. the attack has been detected. This happens if the monitoring mode is enabled.
Blocked - i.e. the attack has been blocked. This happens if the blocking mode is engaged. Allowlist - The attacks added to the White List.
Exploited - i.e. the attack has been detected. This happens if the monitoring mode is enabled.
Blocked - i.e. the attack has been blocked. This happens if the blocking mode is engaged. Allowlist - The attacks added to the White List.
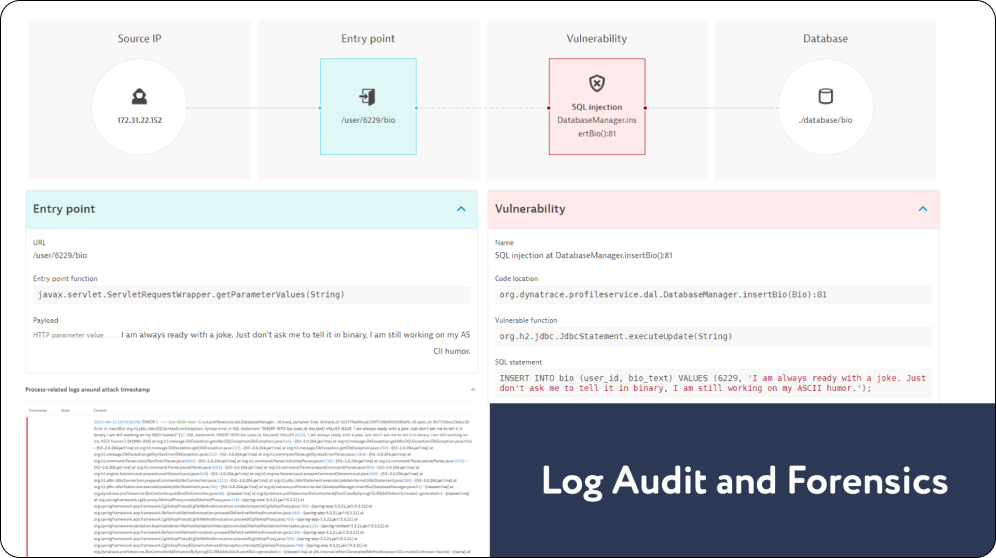
DESK captures the details of each detected attack, specifies the entry point
and the target object, and analyzes the log files and the code of the app.
and the target object, and analyzes the log files and the code of the app.